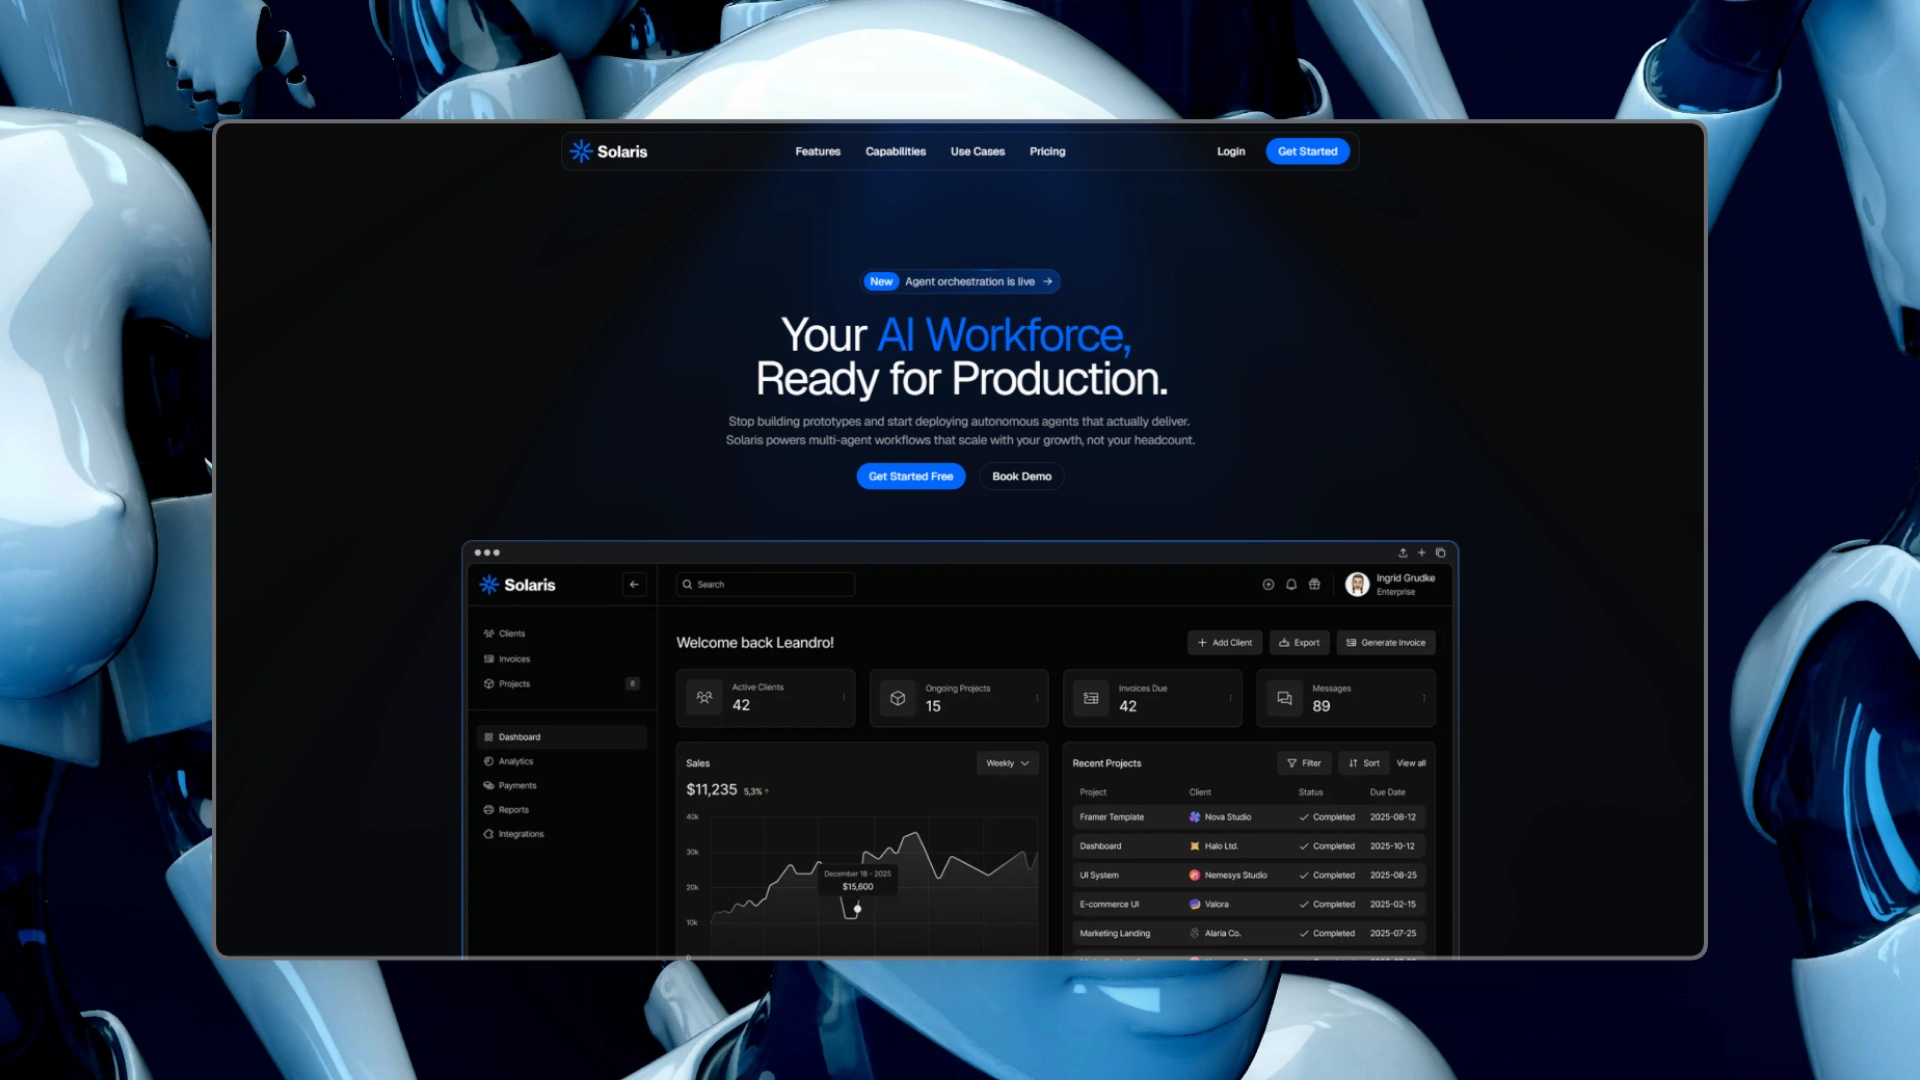
solaris.shadcn.io
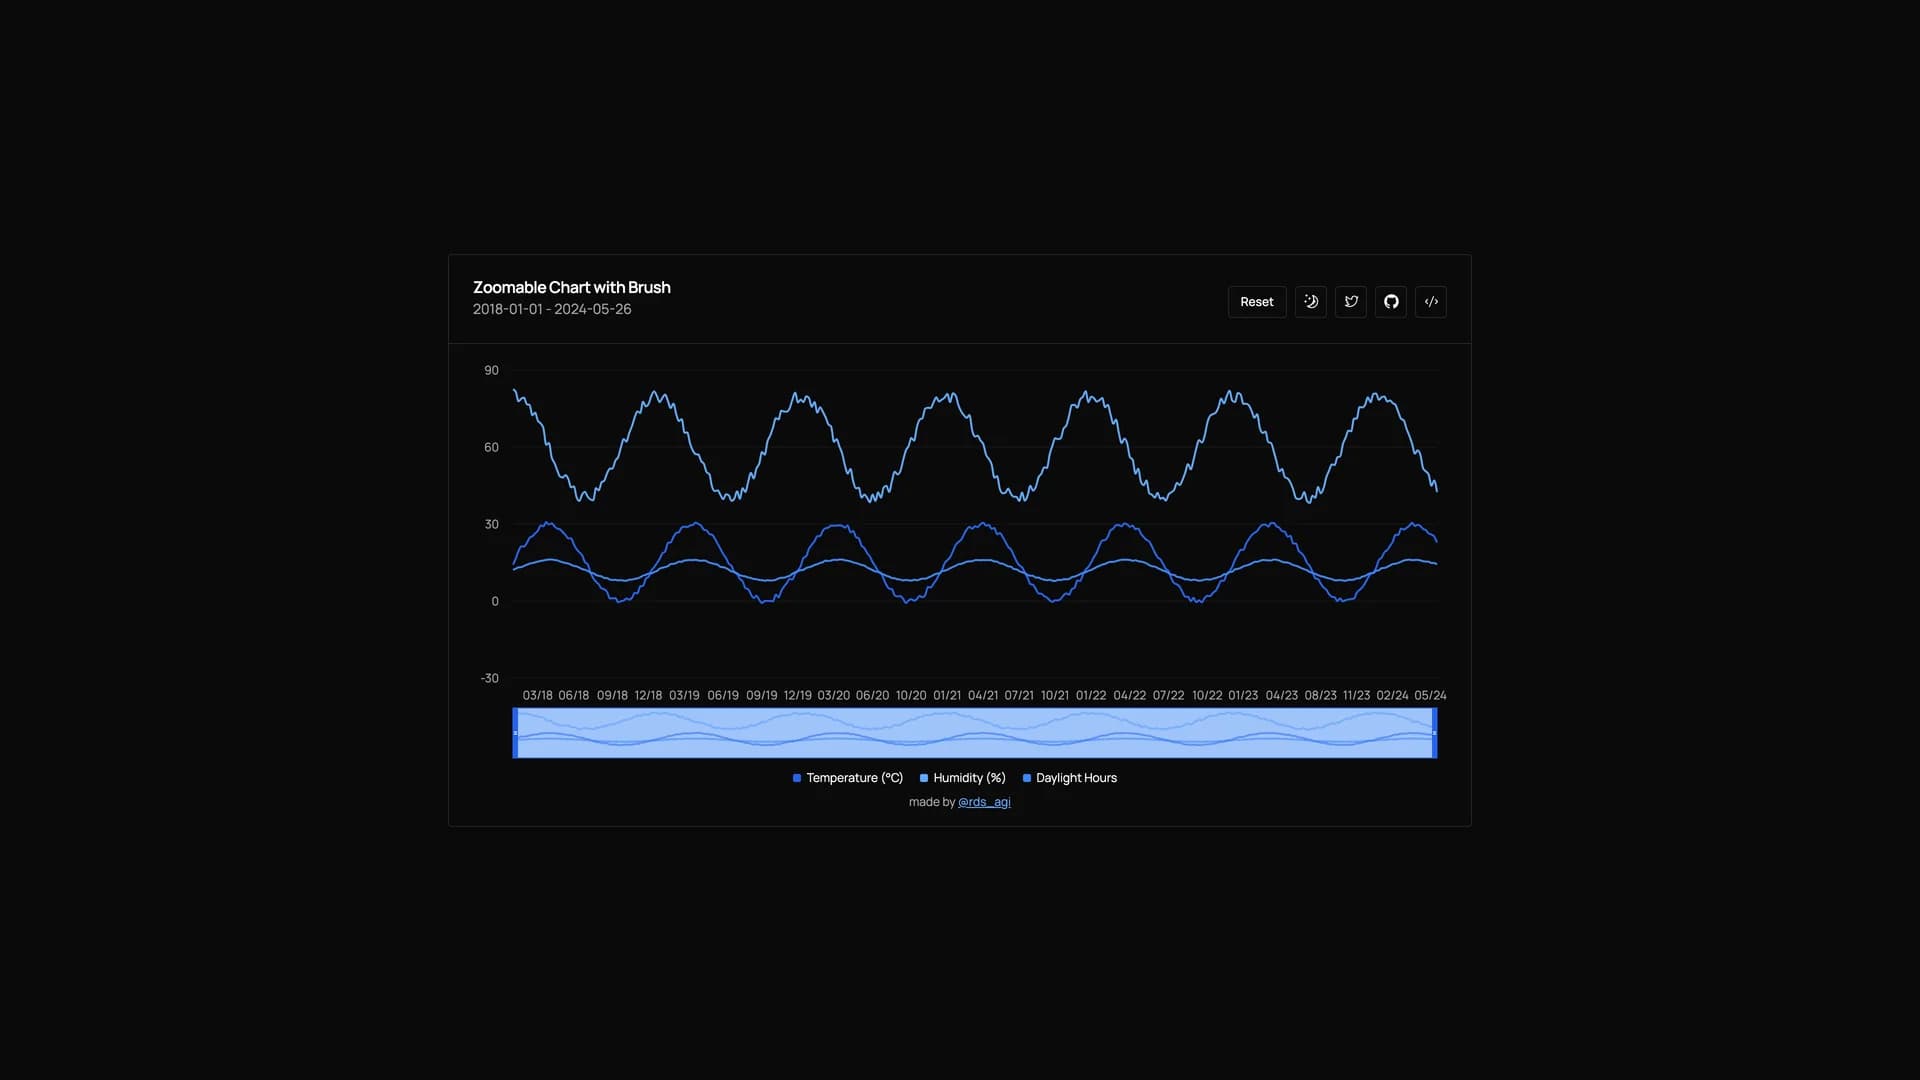
The shadcn Chart Brush is an interactive, zoomable chart component built with shadcn/ui's charting system and Recharts, providing multiple intuitive zoom and pan methods including click-and-drag zoom, scroll wheel zooming, and brush tool for precise navigation through large datasets.
by Rudrodip · Updated October 8, 2025
Interact with the actual deployed template — every section, every interaction, no mockups.
Built with Next.js, React, TypeScript, and Tailwind CSS, this component solves the common challenge of visualizing and exploring large time-series or numerical datasets where users need to focus on specific data ranges without losing context of the overall dataset. The implementation features click-and-drag interaction allowing users to select specific regions to zoom into, scroll wheel zoom for quick magnification adjustments similar to Google Maps, brush tool providing a minimap-style overview with a draggable selection area for zooming and panning, reset button to restore the original view and zoom level, and smooth transitions making zoom and pan operations feel natural and responsive.
Unlike basic chart implementations that show all data without interaction or provide only limited zoom controls, this component combines multiple zoom methods giving users flexibility to explore data in whatever way feels most intuitive for their task. The brush component is particularly powerful for datasets with thousands of points where seeing everything at once obscures meaningful patterns but zooming helps identify trends, anomalies, or specific events. This chart is perfect for building financial dashboards where analysts need to examine price movements across different timescales, analytics platforms displaying website traffic or user behavior over time, scientific applications visualizing experimental data with precise region selection, monitoring tools showing system metrics or logs where zooming helps identify issues, and any data visualization requiring detailed exploration of specific ranges while maintaining context.
The project demonstrates how to implement advanced chart interactions with Recharts, create intuitive zoom and pan controls, build responsive data visualizations with shadcn/ui, and design user-friendly interfaces for data exploration.
Hand-built premium templates from shadcn.io — production-ready and bundled in Pro.