solaris.shadcn.io
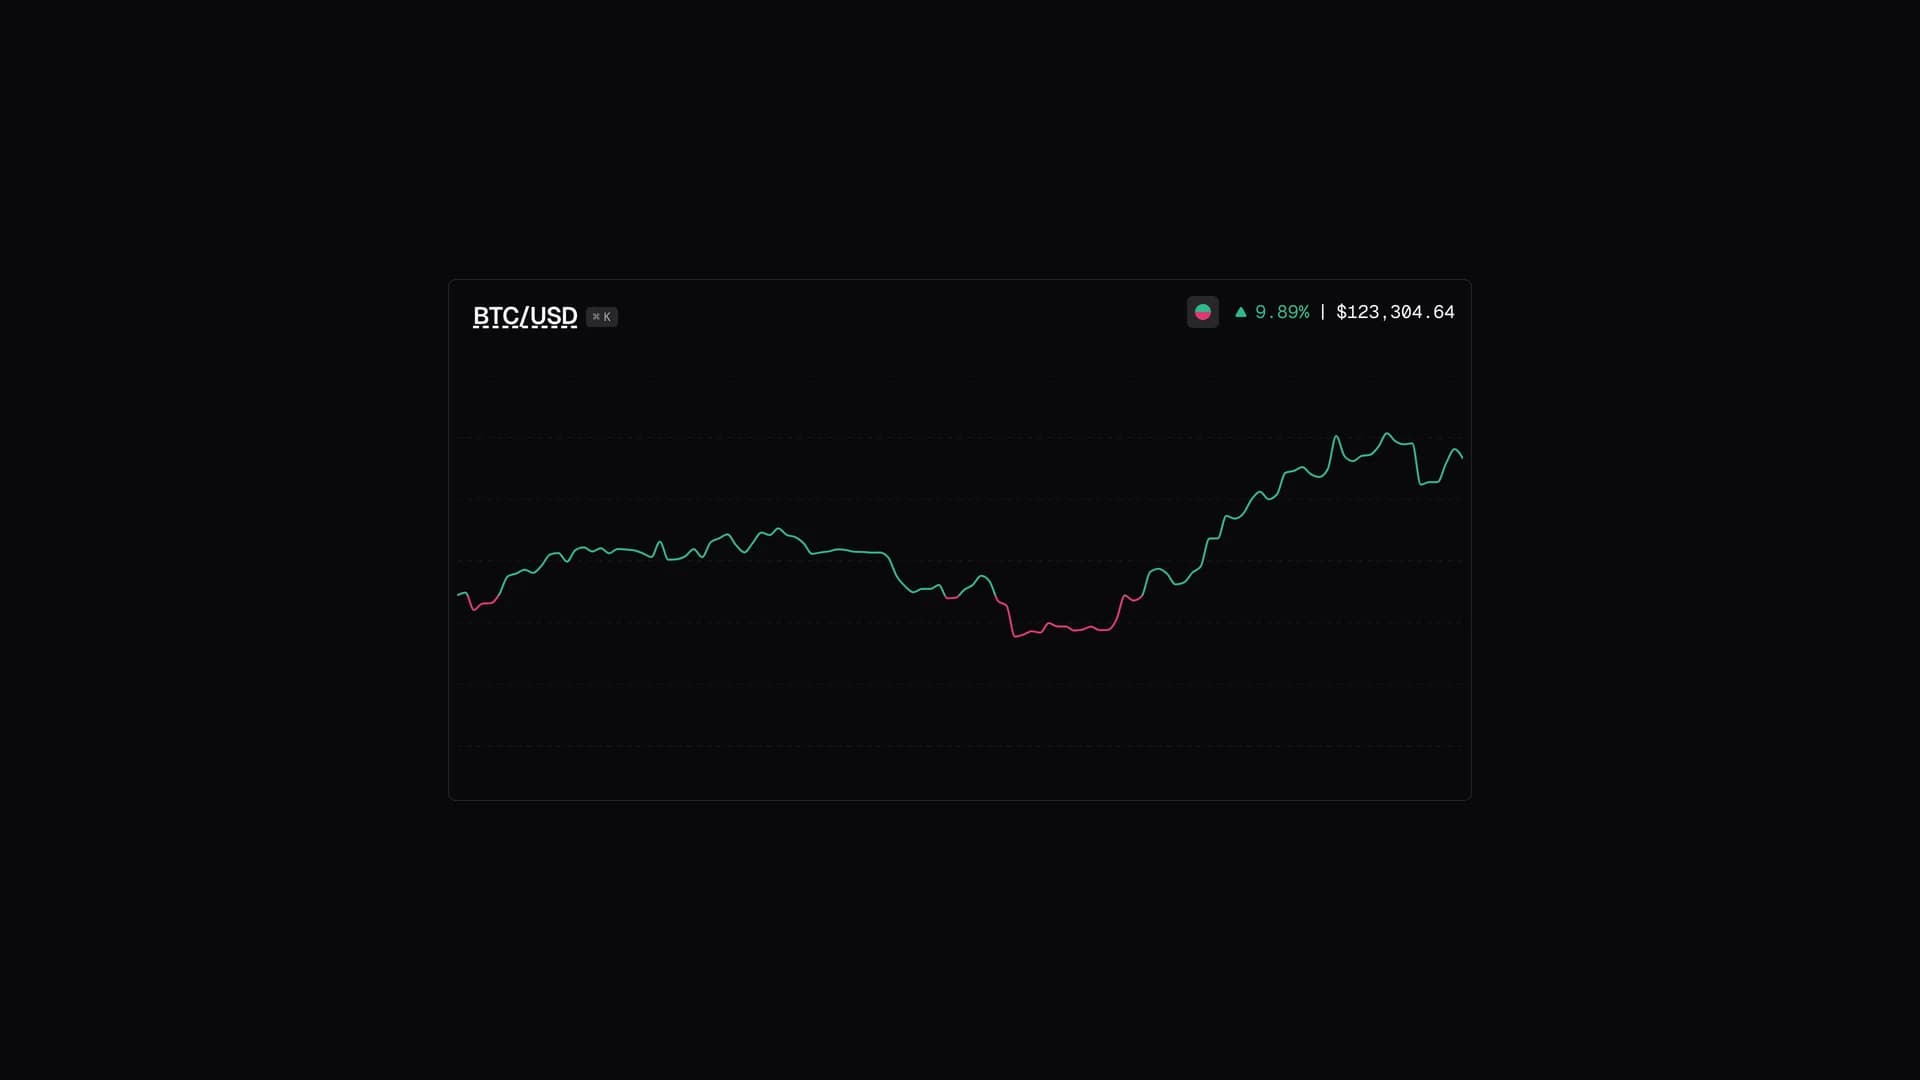
Crypto Charts is a real-time cryptocurrency data visualization application that provides traders and investors with comprehensive market analysis tools and interactive charting capabilities.
by Jstnw10 · Updated October 8, 2025
Interact with the actual deployed template — every section, every interaction, no mockups.
Built with Next.js and modern data visualization libraries, it delivers live cryptocurrency price tracking across multiple exchanges and trading pairs. The application features interactive candlestick charts with technical indicators, real-time price updates via WebSocket connections, multi-timeframe analysis from 1-minute to monthly views, portfolio tracking with profit/loss calculations, and market comparison tools.
Built with shadcn/ui components for professional interface design, it includes responsive charts optimized for desktop and mobile viewing, customizable watchlists, price alerts and notifications, and historical data analysis. The app integrates with major cryptocurrency APIs for accurate market data and supports multiple fiat currency conversions. Perfect for day traders monitoring price action, long-term investors tracking portfolio performance, or anyone researching cryptocurrency markets with professional-grade charting tools.
Hand-built premium templates from shadcn.io — production-ready and bundled in Pro.