shadcn.io is an independent project built on shadcn/ui
Installation
Usage
import { ChartBeeswarmVertical } from "@/components/charts/chart-beeswarm-vertical";<ChartBeeswarmVertical />API Reference
BeeswarmChart
categoryKey?string
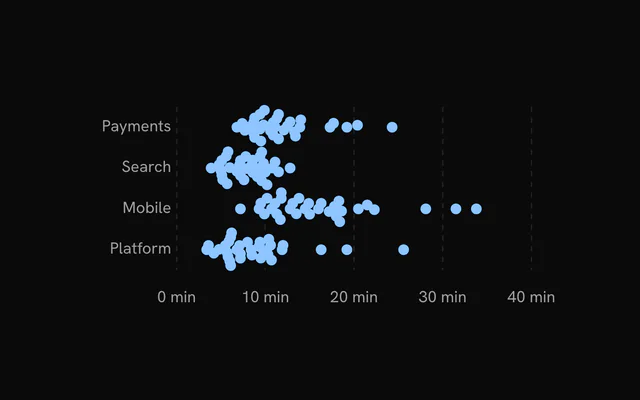
Key of the column naming each row's category: one swarm per category, in first-seen order. Without it, one swarm across the plot.
orientation?"vertical" | "horizontal"
"horizontal": values along the bottom, each category's swarm a row. "vertical": values up the side, each swarm a column.
- Type
"vertical" | "horizontal"- Default
"horizontal"
domain?readonly [number, number]
The value axis range [min, max]. Defaults to the observations' extent, rounded to nice values.
datareadonly DistributionRow[]
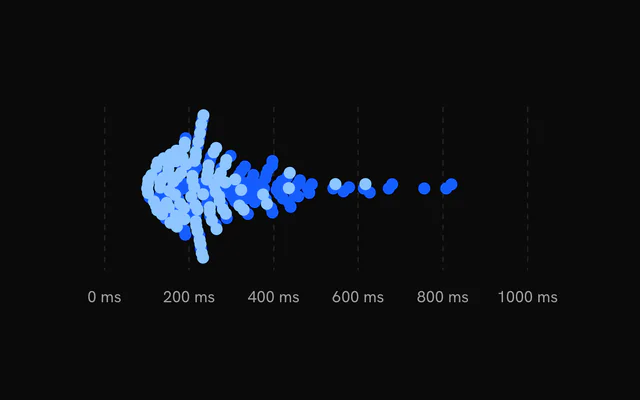
The observations, one object per row. Each series reads its dataKey column; rows without a finite number there are skipped.
aspectRatio?string
Width to height ratio of the chart, for example "2 / 1" or "16 / 9".
- Default
"2 / 1"
margin?Partial<ChartMargin>
Space around the plot in pixels, per side. Each side defaults to fit the chart's axes.
- Type
Partial<ChartMargin>
animationDuration?number
Duration of the entrance in milliseconds.
- Default
1100
ariaLabel?string
Accessible name of the chart. Defaults to its kind, for example "Histogram" or "Box plot".
ariaDescription?string
Accessible description of the chart.
status?ChartStatus
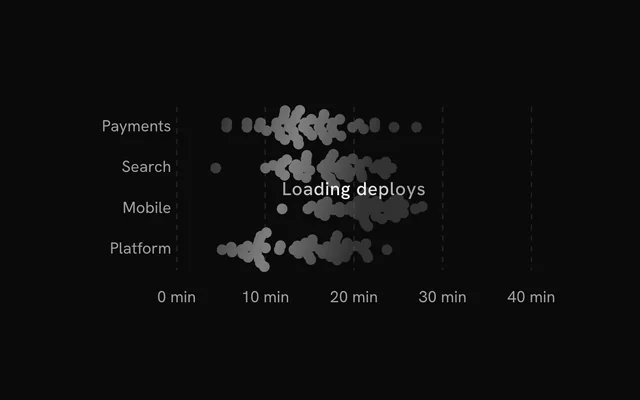
"loading" draws a shimmering skeleton shaped like the chart in place of its marks and ignores the pointer; switching to "ready" plays the entrance. Switching back to "loading" fades the marks out first.
- Default
"ready"
loadingLabel?string
Text shown centered over the plot, with a shimmer, while status is "loading". Nothing is shown when it is unset or empty.
className?string
Class names added to the chart's container.
style?CSSProperties
Inline styles for the chart's container.
children?ReactNode
The chart's parts: its series, Grid, axes and tooltip.
Grid
horizontal?boolean
Show horizontal grid lines.
- Default
true
vertical?boolean
Show vertical grid lines.
- Default
false
numTicksRows?number
Number of horizontal grid lines. Ignored when rowTickValues is set.
- Default
5
numTicksColumns?number
Number of vertical grid lines.
- Default
10
rowTickValues?number[]
Explicit y values for the horizontal grid lines. Overrides numTicksRows.
stroke?string
Color of the grid lines.
- Default
"var(--chart-grid)"
loadingStroke?string
Grid color while the chart is loading. Falls back to stroke.
strokeOpacity?number
Opacity of the grid lines.
- Default
1
strokeWidth?number
Width of the grid lines in px.
- Default
1
strokeDasharray?string
Dash pattern of the grid lines.
- Default
"4,4"
highlightRowValues?number[]
Y values of horizontal lines drawn with the highlight styling, for example a zero baseline.
highlightRowStroke?string
Color of the highlighted rows.
- Default
"var(--chart-foreground-muted)"
highlightRowStrokeOpacity?number
Opacity of the highlighted rows.
- Default
1
highlightRowStrokeWidth?number
Width of the highlighted rows in px.
- Default
1
highlightRowStrokeDasharray?string
Dash pattern of the highlighted rows.
- Default
"0"
fadeHorizontal?boolean
Fade the horizontal lines toward transparent at the left and right edges.
- Default
true
fadeVertical?boolean
Fade the vertical lines toward transparent at the top and bottom edges.
- Default
false
hideHorizontalEdgeLines?boolean
Drop the first and last horizontal line (kept when two or fewer remain).
- Default
false
hideVerticalEdgeLines?boolean
Drop the first and last vertical line (kept when two or fewer remain).
- Default
false
yAxisId?string | number
Accepted for bklit-ui compatibility. It has no effect in bklit-tanstack-charts. The grid follows the primary (left) y scale.
- Type
string | number
shimmer?boolean
While the chart is loading, sweep a bright band across the grid.
- Default
false
shimmerStroke?string
Color of the shimmer band.
- Default
"color-mix(in oklch, var(--bkm-foreground) 68%, transparent)"
shimmerLength?number
Accepted for bklit-ui compatibility. It has no effect in bklit-tanstack-charts.
shimmerSpeed?number
Speed multiplier of the shimmer sweep. 2 is twice as fast.
- Default
1
shimmerSync?boolean
Accepted for bklit-ui compatibility. It has no effect in bklit-tanstack-charts.
Beeswarm
radius?number
Radius of each dot in pixels.
- Default
4
dataKeystring
Key of the numeric column this series reads from each row.
label?string
The series' name in the tooltip and legend. Defaults to dataKey.
fill?string
Fill colour. Defaults to the series' palette colour, var(--chart-1) for the first.
stroke?string
Outline colour. Defaults to the fill.
fadedOpacity?number
Opacity of the other items while one is hovered (and of the other series while a legend row is).
- Default
0.3
animate?boolean
Play the entrance.
- Default
true
BeeswarmXAxis
numTicks?number
Target number of tick labels on a value axis.
- Default
5
formatLargeNumbers?boolean
Abbreviate values of 1000 and above as thousands, for example 2k or 1.5k. Ignored when formatValue is set.
- Default
true
formatValue?(value: number) => string
Formats a value tick into its label, for example (value) => \${value} ms\``.
- Type
(value: number) => string
BeeswarmYAxis
numTicks?number
Target number of tick labels on a value axis.
- Default
5
formatLargeNumbers?boolean
Abbreviate values of 1000 and above as thousands, for example 2k or 1.5k. Ignored when formatValue is set.
- Default
true
formatValue?(value: number) => string
Formats a value tick into its label, for example (value) => \${value} ms\``.
- Type
(value: number) => string
BeeswarmTooltip
content?(context: DistributionTooltipContext<BeeswarmPoint>) => ReactNode
Replaces the default panel body (a title over one row per value) with your own content for the hovered item.
- Type
(context: DistributionTooltipContext<BeeswarmPoint>) => ReactNode
formatValue?(value: number) => string
Formats the values the default body shows. Defaults to the chart's value axis formatValue, else en-US numbers.
- Type
(value: number) => string