shadcn.io is an independent project built on shadcn/ui
Installation
Usage
import { ChartFunnelLegend } from "@/components/charts/chart-funnel-legend";<ChartFunnelLegend />API Reference
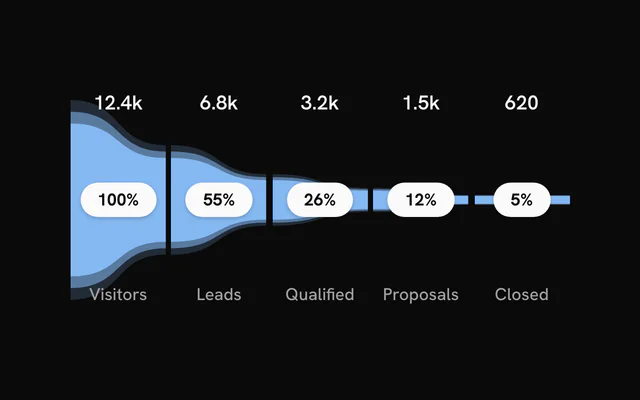
FunnelChart
dataFunnelStage[]
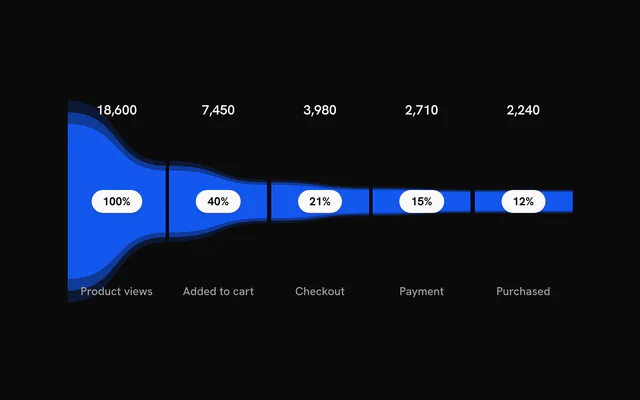
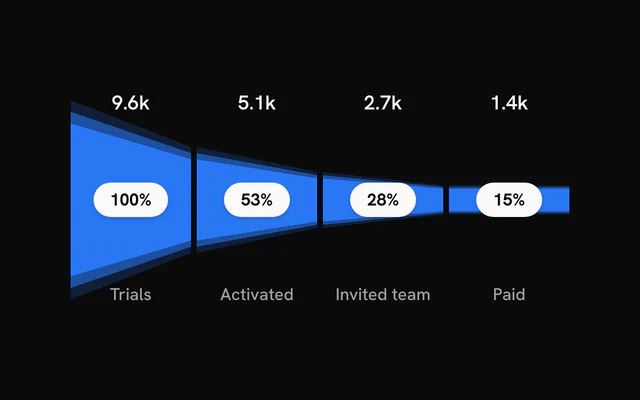
The stages, in order from widest to narrowest. The chart renders nothing when this is empty.
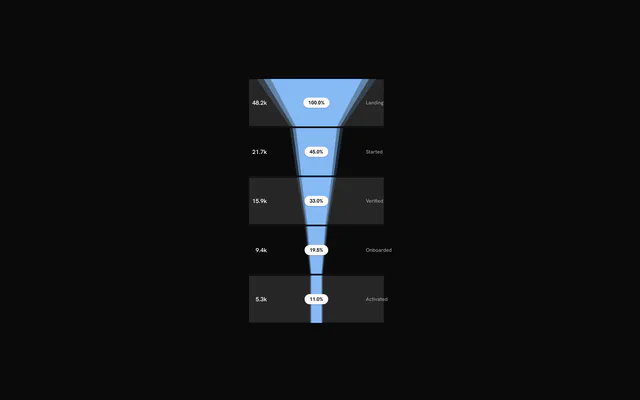
orientation?"horizontal" | "vertical"
"horizontal" lays the stages out left to right; "vertical" top to bottom.
- Type
"horizontal" | "vertical"- Default
"horizontal"
color?string
Default colour of the stages. A stage's own color or gradient overrides it.
- Default
"var(--chart-1)"
layers?number
Number of concentric halo rings drawn for each stage.
- Default
3
className?string
Extra class name for the chart container.
style?CSSProperties
Inline styles for the chart container.
showPercentage?boolean
Show each stage's share of the first stage as a badge.
- Default
true
showValues?boolean
Show each stage's value.
- Default
true
showLabels?boolean
Show each stage's name.
- Default
true
hoveredIndex?number | null
Index of the hovered stage, for controlled hover. Pass null for no hover; leave it undefined to let the chart manage hover itself.
- Type
number | null
onHoverChange?(index: number | null) => void
Called with the index of the hovered or keyboard-focused stage, or null when hover ends.
- Type
(index: number | null) => void
formatPercentage?(pct: number) => string
Formats a percentage (0 to 100) for the badge. Defaults to a rounded whole number with a % sign.
- Type
(pct: number) => string
formatValue?(value: number) => string
Formats a stage value for display. Defaults to a whole number with locale grouping.
- Type
(value: number) => string
staggerDelay?number
Delay between one stage's entrance and the next, in seconds.
- Default
0.12
enterTransition?Transition
Transition for the stage entrance, in the shape used by the motion library: a tween (duration in seconds, default 1.1, and ease, a four-number cubic-bezier or one of motion's named eases such as "easeOut") or type: "spring" (stiffness, damping, mass, or duration and bounce).
gap?number
Gap between stages in pixels.
- Default
4
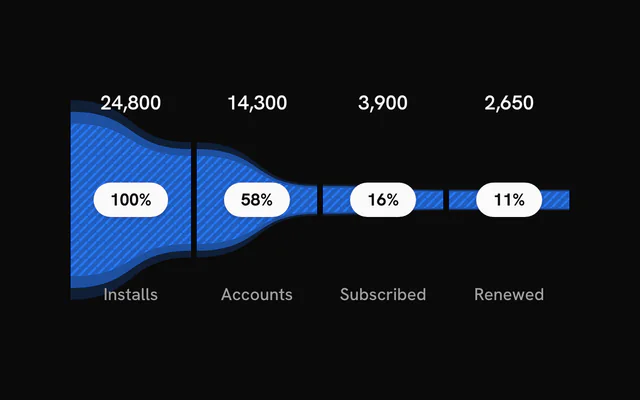
renderPattern?(id: string, color: string) => ReactNode
Returns a pattern definition (for example an SVG <pattern>) for each stage, called with a unique id and the stage colour. The pattern paints the innermost ring; the outer halo rings stay solid.
- Type
(id: string, color: string) => ReactNode
edges?"curved" | "straight"
"curved" joins stages with smooth curves; "straight" uses straight edges.
- Type
"curved" | "straight"- Default
"curved"
labelLayout?"spread" | "grouped"
"spread" places the value, percentage and name apart within the segment; "grouped" stacks them together.
- Type
"spread" | "grouped"- Default
"spread"
labelOrientation?FunnelLabelOrientation
Stack direction of grouped labels. Only used with labelLayout="grouped". Defaults to "vertical" for horizontal funnels and "horizontal" for vertical ones.
labelAlign?FunnelLabelAlign
Where grouped labels sit in their segment: "center", "start" (top or left) or "end" (bottom or right). Only used with labelLayout="grouped".
- Default
"center"
grid?boolean | { readonly bands?: boolean; readonly bandColor?: string; readonly lines?: boolean; readonly lineColor?: string; readonly lineOpacity?: number; readonly lineWidth?: number }
Background bands and grid lines. true enables both with default styling; an object adjusts them. Off by default.
- Type
boolean | { readonly bands?: boolean; readonly bandColor?: string; readonly lines?: boolean; readonly lineColor?: string; readonly lineOpacity?: number; readonly lineWidth?: number }- Default
false
ariaLabel?string
Accessible name of the chart.
- Default
"Funnel chart"
ariaDescription?string
Longer accessible description of the chart. Default: a summary of its stages.
dataTable?ChartDataTableProps
The chart's data as an HTML table (a <ChartDataTable>'s props: the funnel takes no children): {} for a visually hidden table, { toggle: true } for a "View as table" button.
ChartLegend
itemsLegendItem[]
The items to list.
hoveredIndex?number | null
Hovered item index (null for none). Pair it with onHover to share hover with a chart.
- Type
number | null- Default
null
onHover?(index: number | null) => void
Called with the item index when the pointer enters a row, and null when it leaves.
- Type
(index: number | null) => void
showProgress?boolean
Show a progress bar under each item that has a maxValue.
- Default
false
showMarker?boolean
Show the colored dot before each label.
- Default
true
showValue?boolean
Show each item's value.
- Default
true
showPercentage?boolean
Show each item's percentage of maxValue, under its progress bar: it takes effect only with showProgress and an item maxValue, as in bklit-ui (chart-legend.tsx:115, where the plain row has no percentage). For a percentage without a bar, compose Legend with LegendValue showPercentage.
- Default
the value of `showProgress`
formatValue?(value: number) => string
Formats each value.
- Type
(value: number) => string- Default
en-US number format, for example "1,234"
title?string
Heading shown above the items.
className?string
Class names added to the legend container.
titleClassName?string
Class names added to the title, on top of the default title style.
itemClassName?string
Class names added to each row.
labelClassName?string
Class names that replace the default label text style.
valueClassName?string
Class names that replace the default value text style.
renderItem?(props: Readonly<{ readonly item: LegendItem; readonly index: number; readonly isHovered: boolean; readonly isFaded: boolean; readonly percentage: number }>) => ReactNode
Renders a row yourself. Receives the item, its index, hover flags and its percentage of maxValue. When set, the show* options are ignored.
- Type
(props: Readonly<{ readonly item: LegendItem; readonly index: number; readonly isHovered: boolean; readonly isFaded: boolean; readonly percentage: number }>) => ReactNode