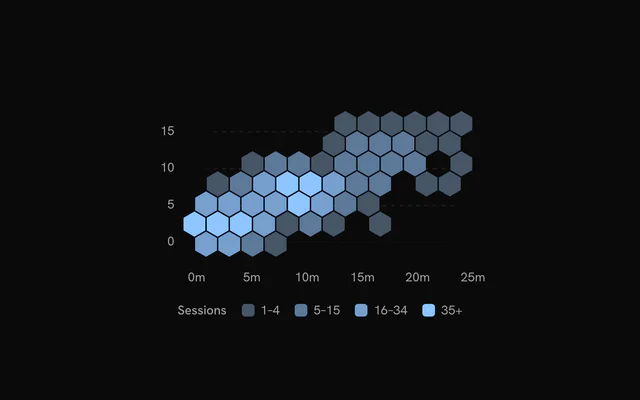
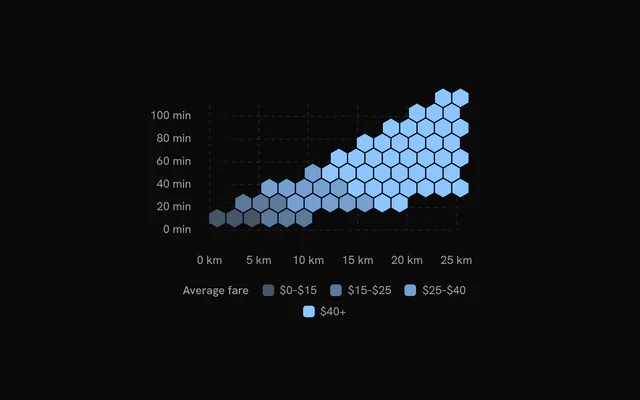
shadcn.io is an independent project built on shadcn/ui
Installation
Usage
import { ChartHexbinCustomTooltip } from "@/components/charts/chart-hexbin-custom-tooltip";<ChartHexbinCustomTooltip />API Reference
HexbinChart
datareadonly SpatialRow[]
The observations to bin: one row per point. Rows without a finite x or y are left out.
xDataKeystring
Key of the horizontal value in each row.
yDataKeystring
Key of the vertical value in each row.
xDomain?readonly [number, number]
The x range shown. Defaults to the data's, rounded out to nice values.
yDomain?readonly [number, number]
The y range shown. Defaults to the data's, rounded out to nice values.
aspectRatio?string
Aspect ratio of the chart as "width / height".
- Default
"16 / 9"
margin?Partial<SpatialMargin>
Space around the plot in pixels. Any side you omit keeps its default.
- Type
Partial<SpatialMargin>
animate?boolean
Play the entrance animation.
- Default
true
animationDuration?number
Length of the entrance sweep in milliseconds: the time from the first mark starting to the last one.
- Default
900
revealSignature?string
Changing this value replays the entrance animation.
status?ChartStatus
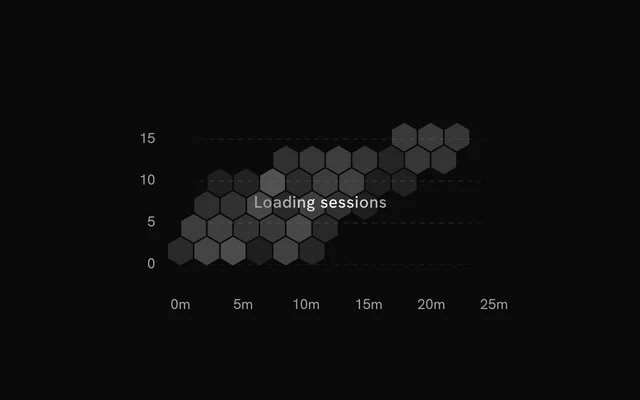
"loading" draws a pulsing skeleton of the chart's shape in place of its marks (the axes, grid and land stay) and ignores the pointer; switching to "ready" plays the entrance.
- Default
"ready"
loadingLabel?string
Text shown centered over the chart, with a shimmer, while status is "loading". Nothing is shown when it is unset or empty.
className?string
Additional class name for the chart container.
children?ReactNode
The chart's carriers: its layers, axes, grid, tooltip and legend.
ariaLabel?string
Accessible label of the chart.
ariaDescription?string
Longer accessible description of the chart.
HexbinGrid
horizontal?boolean
Show horizontal grid lines, at the y axis's ticks.
- Default
true
vertical?boolean
Show vertical grid lines, at the x axis's ticks.
- Default
false
stroke?string
Color of the grid lines.
- Default
"var(--chart-grid)"
strokeDasharray?string
Dash pattern of the grid lines.
- Default
"4 4"
HexbinCells
binWidth?number
Horizontal distance between neighbouring bin centers, in pixels. Bins are laid out at the chart's size, so a narrower chart groups more observations per bin.
- Default
22
valueDataKey?string
Key of a value to combine per bin (with reduce) instead of counting observations.
reduce?HexbinReduce
How a bin's observations combine into its value: their number, or the sum or mean of valueDataKey.
- Default
"count", or "sum" when `valueDataKey` is set
colors?readonly string[]
The fills from the lowest values to the highest.
- Default
the sequential scale `var(--chart-scale-02)` … `var(--chart-scale-05)`
thresholds?readonly number[]
The values at which each fill after the first starts (one fewer than colors). Defaults to equal steps up to the largest bin.
gap?number
Gap between neighbouring hexagons, in pixels.
- Default
1.5
stroke?string
Border color of the hexagons.
fadeOnHover?boolean
Dim the layer's other marks while one is hovered or focused.
- Default
true
inactiveOpacity?number
Opacity of the other marks while one is hovered or focused.
- Default
0.35
HexbinXAxis
numTicks?number
Target number of tick labels.
- Default
5
formatValue?(value: number) => string
Formats a tick value into its label. Defaults to the number, thousands abbreviated (2k).
- Type
(value: number) => string
label?string
A title for the axis, drawn beside its labels.
HexbinYAxis
numTicks?number
Target number of tick labels.
- Default
5
formatValue?(value: number) => string
Formats a tick value into its label. Defaults to the number, thousands abbreviated (2k).
- Type
(value: number) => string
label?string
A title for the axis, drawn beside its labels.
HexbinTooltip
formatPosition?(x: number, y: number) => string
Formats the bin's x and y values for the default title.
- Type
(x: number, y: number) => string
content?(args: HexbinTooltipArgs) => ReactNode
Custom tooltip content. Replaces the default title and rows, inside the same panel.
- Type
(args: HexbinTooltipArgs) => ReactNode
formatValue?(value: number) => string
Formats the value row of the default content.
- Type
(value: number) => string- Default
the number with thousands separators
valueLabel?string
The label of the value row of the default content.
className?string
Additional class name for the tooltip panel.
panelStyle?CSSProperties
Inline styles merged onto the tooltip panel.
backgroundColor?string
Background color of the tooltip panel. Overrides the theme's popover color.