shadcn.io is an independent project built on shadcn/ui
Installation
Usage
import { ChartRadarHoverLegend } from "@/components/charts/chart-radar-hover-legend";<ChartRadarHoverLegend />API Reference
RadarChart
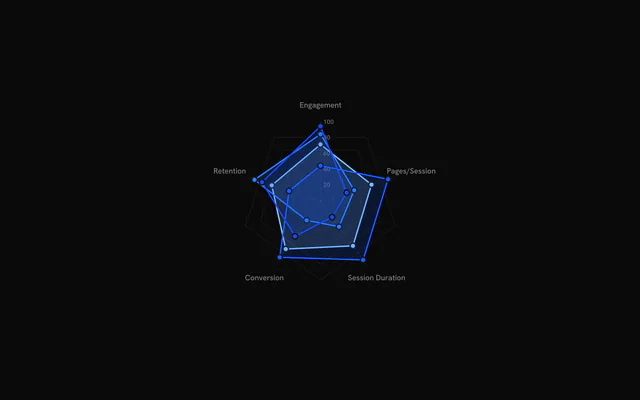
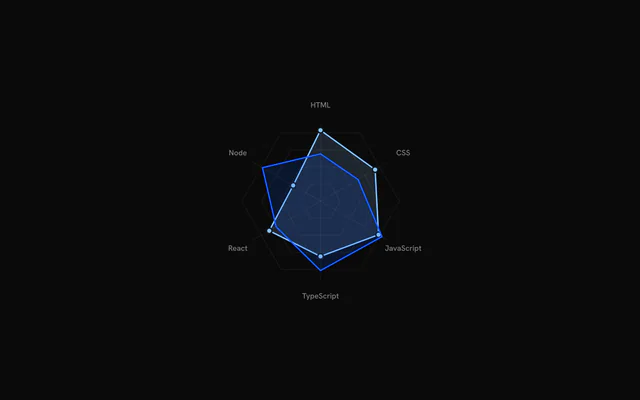
dataRadarData[]
The series to draw, one polygon each. Every item holds a values record keyed by metric key; the series index is what RadarArea refers to with index.
metricsRadarMetric[]
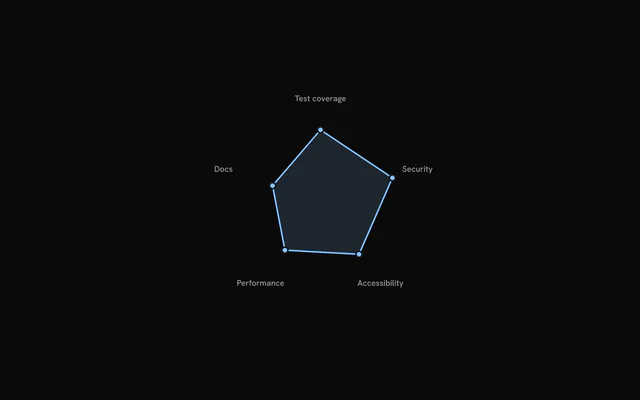
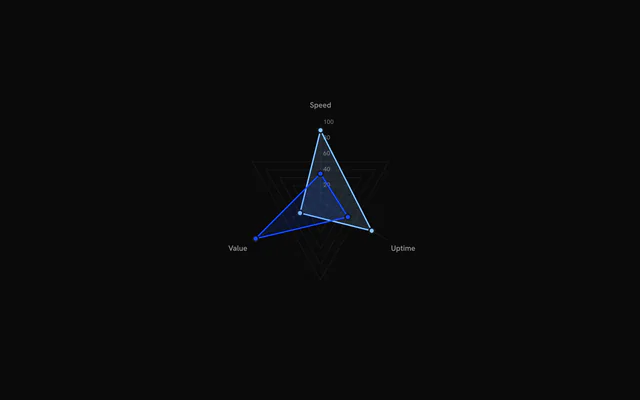
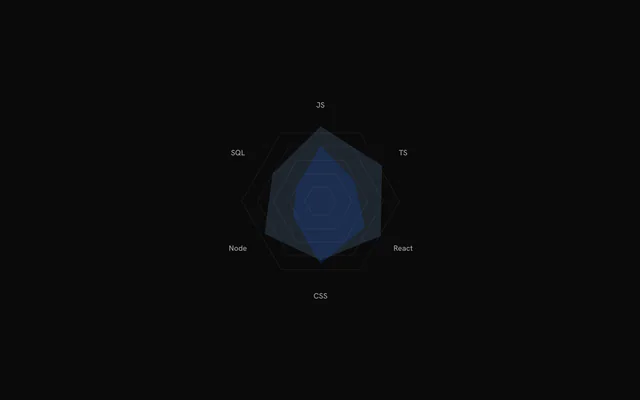
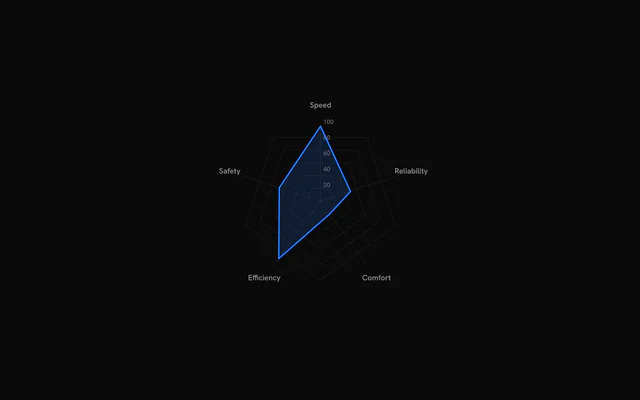
The metrics, one spoke each, in clockwise order from 12 o'clock. A metric's key selects its value in every series' values, and its label is what RadarLabels prints.
size?number
Chart width and height in pixels. Omit to fill the width of the parent element; the chart stays square.
levels?number
Number of concentric grid rings drawn by RadarGrid. Ring n marks n / levels of the 0 to 100 value scale.
- Default
5
margin?number
Space in pixels kept free around the chart for the metric labels.
- Default
60
animate?boolean
Play the entrance animation. Set false to draw the chart immediately.
- Default
true
enterDurationMs?number
Total time budget of the entrance animation in milliseconds. Grid, labels and series timings scale with it.
- Default
1100
staggerScale?number
Multiplier for the delays between grid rings, labels and series during the entrance. 0 starts everything together.
- Default
1
enterTransition?RadarEnterTransition
Transition for the series entrance, in the shape used by the motion library (type: "spring" with spring values, or a tween with duration in seconds and ease). Defaults to a 1.1 second tween on the shared reveal curve.
motionReplayKey?string
Changing this string replays the entrance animation.
- Default
""
hoveredIndex?number | null
Index of the hovered series, for controlled hover. Pass null for no hover; leave it undefined to let the chart manage hover itself.
- Type
number | null
onHoverChange?(index: number | null) => void
Called with the index of the hovered or keyboard-focused series, or null when hover ends.
- Type
(index: number | null) => void
className?string
Extra class name for the chart container.
style?CSSProperties
Inline styles for the chart container, merged over the default sizing.
childrenReactNode
The parts to draw: RadarGrid, RadarAxis, RadarLabels and one RadarArea per series. Only the parts you include are drawn.
ariaLabel?string
Accessible name of the chart.
- Default
"Radar chart"
ariaDescription?string
Longer accessible description of the chart.
RadarGrid
showLabels?boolean
Print the value of each grid ring along the first spoke.
- Default
true
stroke?string
Colour of the grid lines.
- Default
"var(--bkm-border)"
strokeOpacity?number
Opacity of the grid lines, from 0 to 1.
- Default
0.6
className?string
Extra class name for the grid lines.
RadarAxis
stroke?string
Colour of the axis lines.
- Default
"var(--bkm-border)"
strokeOpacity?number
Opacity of the axis lines, from 0 to 1.
- Default
0.6
className?string
Extra class name for the axis lines.
RadarLabels
offset?number
Distance in pixels between the outer grid ring and the labels.
- Default
24
fontSize?number
Font size of the labels in pixels.
- Default
11
interactive?boolean
Dim the labels at rest and brighten them while a series is hovered.
- Default
false
className?string
Extra class name for the labels.
RadarArea
indexnumber
Index of the series this element draws, matching its position in the data array of the chart. Entries with an index outside the array are ignored.
color?string
Colour of the series. Takes precedence over the data item's color, which in turn takes precedence over the --chart-1 to --chart-5 palette (by index).
showPoints?boolean
Draw a dot at each metric value.
- Default
true
showStroke?boolean
Draw an outline around the polygon.
- Default
true
showGlow?boolean
Draw a glow behind the polygon while the series is hovered: a 12 px drop shadow in the series colour.
- Default
false
className?string
Extra class name for the polygon.
ChartLegend
itemsLegendItem[]
The items to list.
hoveredIndex?number | null
Hovered item index (null for none). Pair it with onHover to share hover with a chart.
- Type
number | null- Default
null
onHover?(index: number | null) => void
Called with the item index when the pointer enters a row, and null when it leaves.
- Type
(index: number | null) => void
showProgress?boolean
Show a progress bar under each item that has a maxValue.
- Default
false
showMarker?boolean
Show the colored dot before each label.
- Default
true
showValue?boolean
Show each item's value.
- Default
true
showPercentage?boolean
Show each item's percentage of maxValue, under its progress bar: it takes effect only with showProgress and an item maxValue, as in bklit-ui (chart-legend.tsx:115, where the plain row has no percentage). For a percentage without a bar, compose Legend with LegendValue showPercentage.
- Default
the value of `showProgress`
formatValue?(value: number) => string
Formats each value.
- Type
(value: number) => string- Default
en-US number format, for example "1,234"
title?string
Heading shown above the items.
className?string
Class names added to the legend container.
titleClassName?string
Class names added to the title, on top of the default title style.
itemClassName?string
Class names added to each row.
labelClassName?string
Class names that replace the default label text style.
valueClassName?string
Class names that replace the default value text style.
renderItem?(props: Readonly<{ readonly item: LegendItem; readonly index: number; readonly isHovered: boolean; readonly isFaded: boolean; readonly percentage: number }>) => ReactNode
Renders a row yourself. Receives the item, its index, hover flags and its percentage of maxValue. When set, the show* options are ignored.
- Type
(props: Readonly<{ readonly item: LegendItem; readonly index: number; readonly isHovered: boolean; readonly isFaded: boolean; readonly percentage: number }>) => ReactNode