shadcn.io is an independent project built on shadcn/ui
Installation
Overview
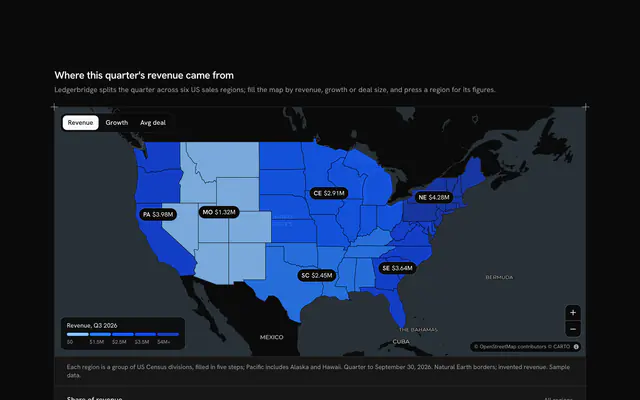
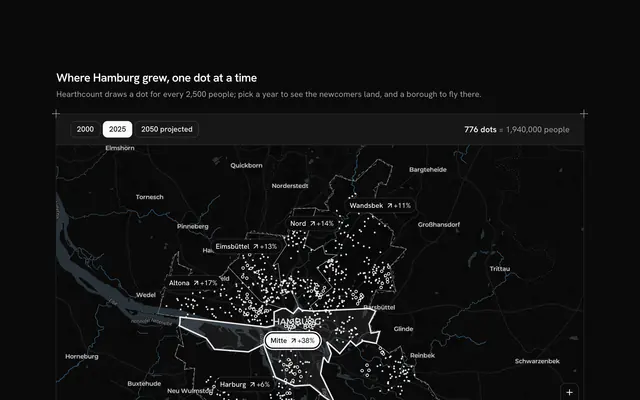
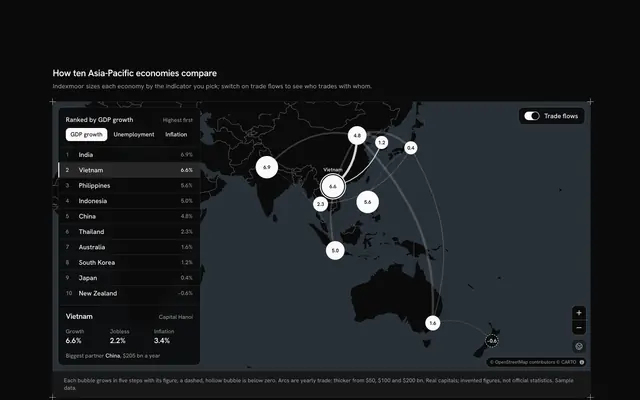
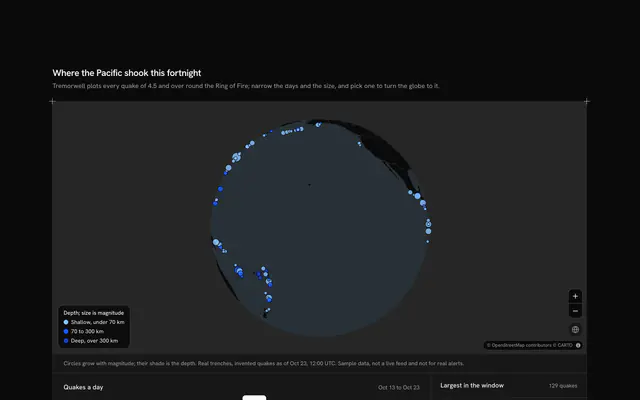
Put a whole analytics view in one card, with this analytics card map for Solid with Ark UI. Visitwren, a web analytics tool, counts one site's visitors across fourteen European cities, from Lisbon to Warsaw, on a small live Map that follows your theme, light or dark. A Toggle Group in the card's head picks the period (7, 30 or 90 days), and everything moves with it: the three KPI cells (visitors, average visit and conversion) give each figure and its change on the period before, with an arrow and a sign rather than a colour; every city's circle grows or shrinks, its area following its visits; and the ranked list under the map re-orders, each row with its visits, its share and a bar against the top city. Hover a circle to read it in the map's corner; choose a city, by its circle or its row, to ring it and fly the map there, and the globe button frames all fourteen again. Built from Map, Toggle Group, Button and Guides. For analytics products, admin dashboards, marketing reports and any card that needs a where.
FAQ
How are the circles sized?
Each circle's area follows the city's visits in the period: its radius grows with the square root of the city's visits over the top city's, so twice the visits makes twice the area, not twice the width. The radius also grows a little as the map zooms in, so close cities don't merge when you look at the whole of Europe.
How are the KPIs and their changes worked out?
Visitors is the sum of the fourteen cities in the period; its change compares it with the period before, typed beside each period. The average visit changes in percent; conversion changes in percentage points, since it is a rate already. Every change shows an arrow and a sign as well as the number, so it reads without colour.
Where does the data come from, and what stays local?
Every figure is typed into LINES and PERIOD_LINES at the top of the file: the cities and their places are real; Visitwren, the site and the visits are invented. Nothing is fetched or saved except the map's tiles. In your app, fill the same shapes from your analytics endpoint for the chosen period.
Can I use it without a mouse?
Yes. The period is a toggle group, and every city in the ranked list is a button that rings it on the map and flies there, the same as pressing its circle. The zoom buttons and the globe button work from the keyboard, and the map takes the arrow keys and plus and minus once focused. A polite message gives the period's visitors and the chosen city's figures once the choice settles.