Charts for Vue.
44 chart types on TanStack Charts for Vue, from line and bar charts to Sankey diagrams and maps. Each has docs written for Vue and live examples, 330 in all, styled by your shadcn/ui theme. Free with an account.
Every chart type
45 chart types, 330 examples.
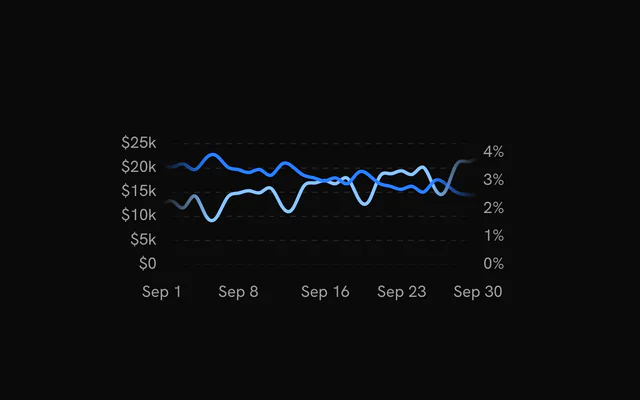
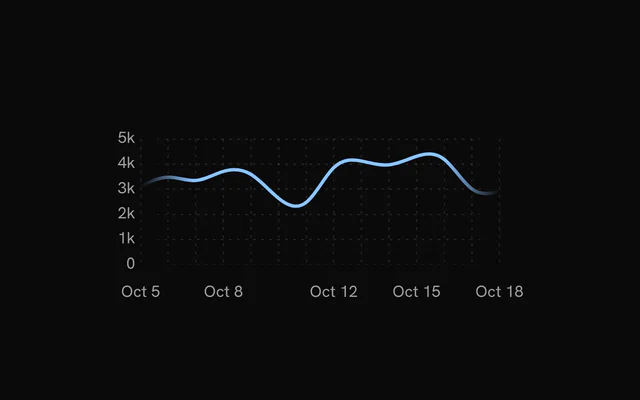
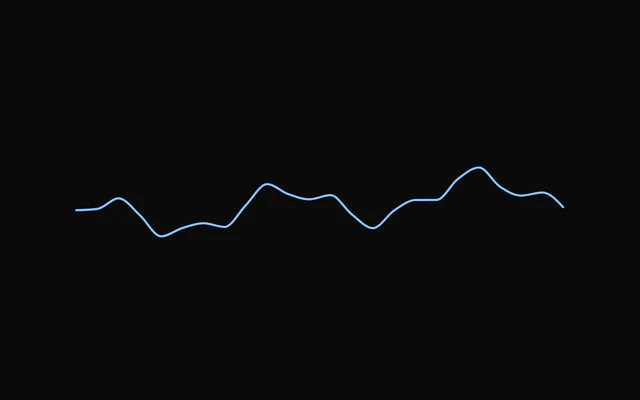
- Line chart41 examples
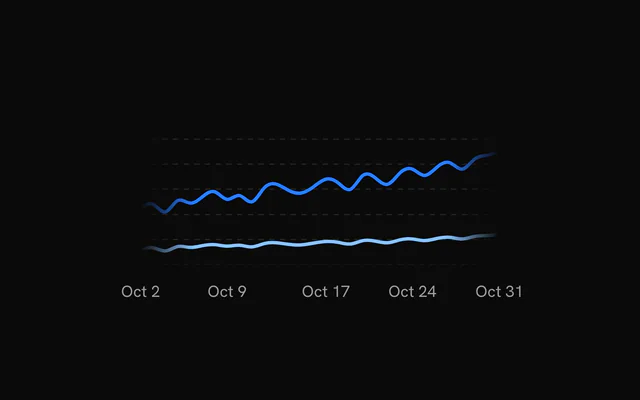
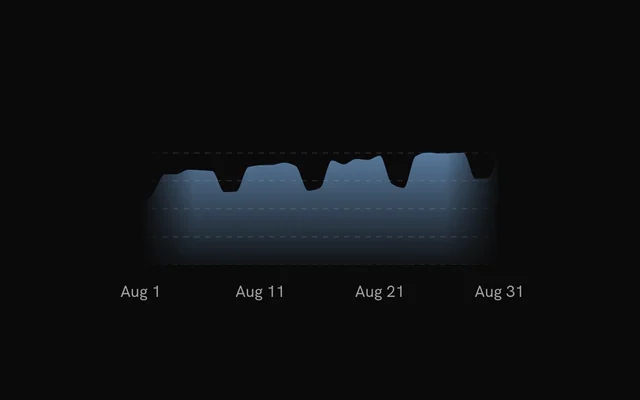
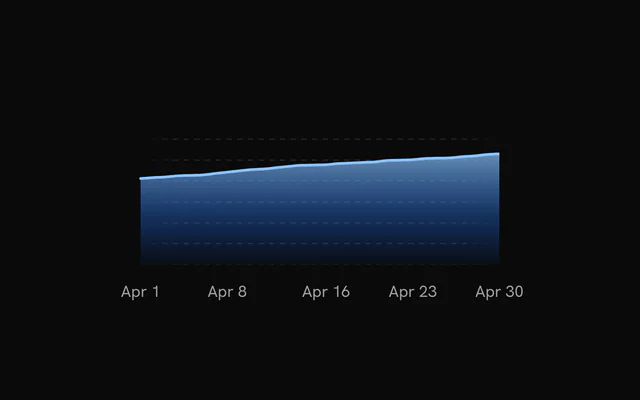
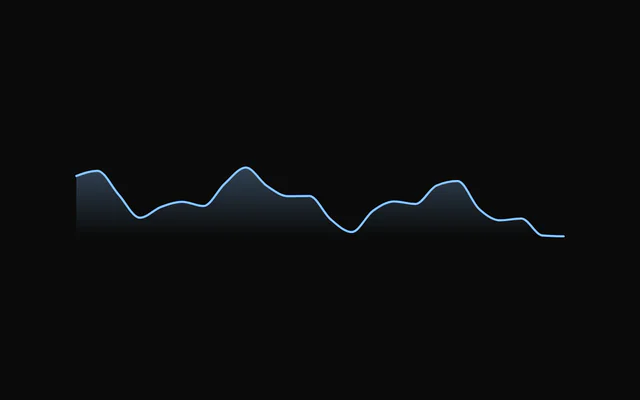
- Area chart20 examples
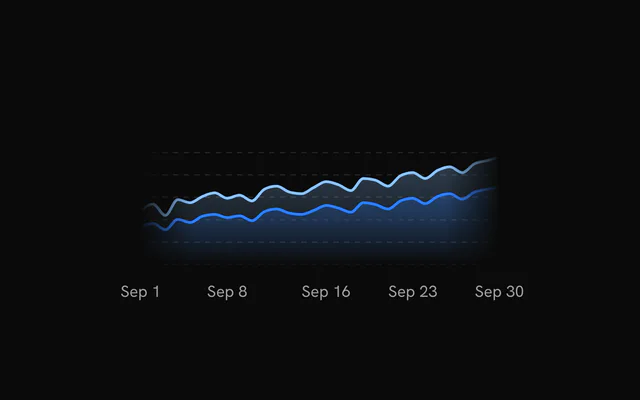
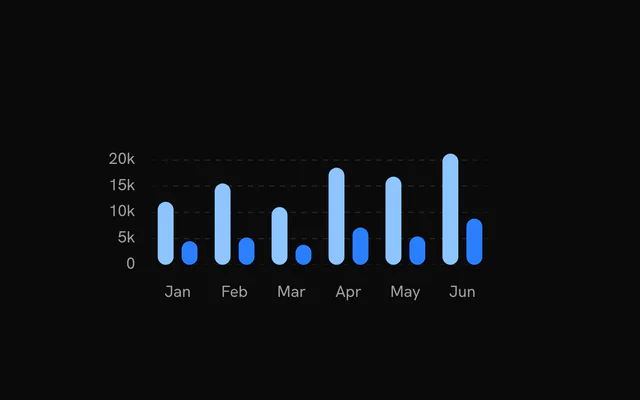
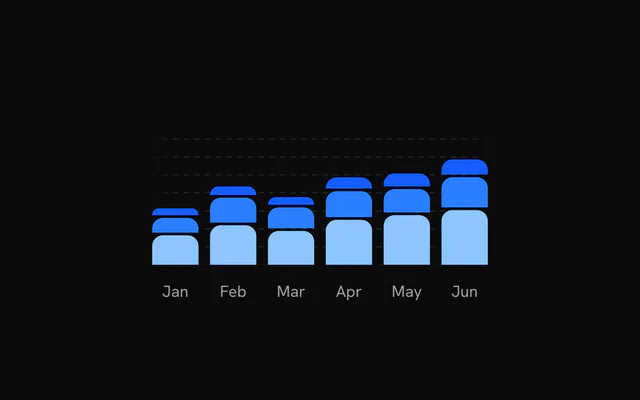
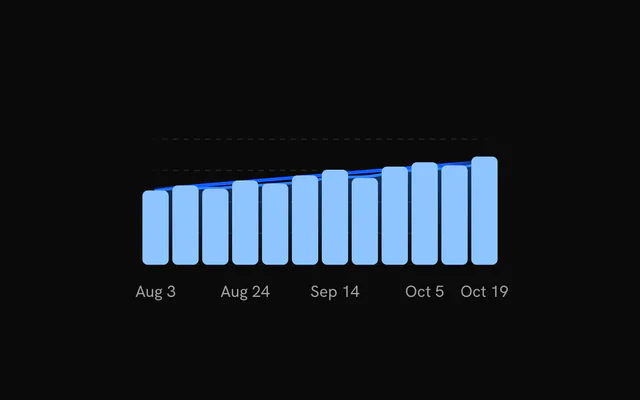
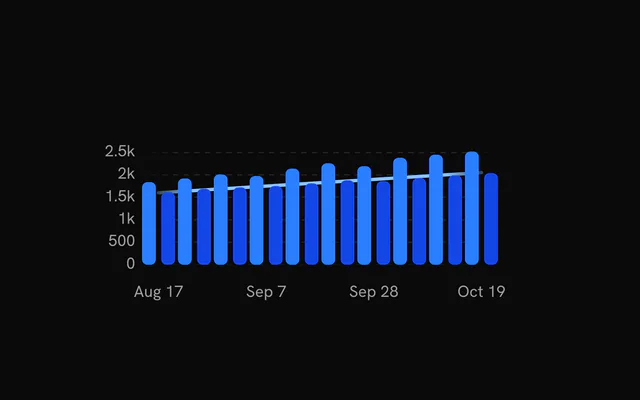
- Bar chart11 examples
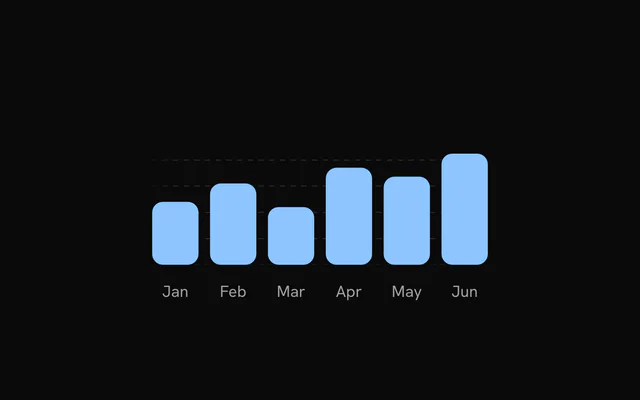
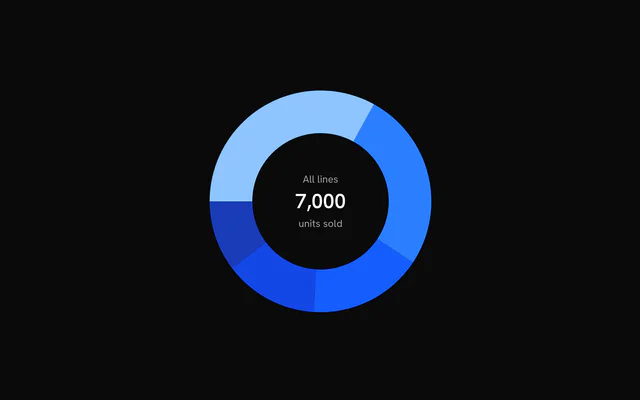
- Pie chart14 examples
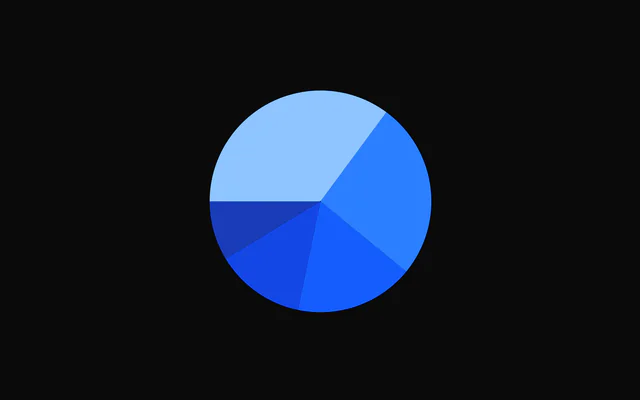
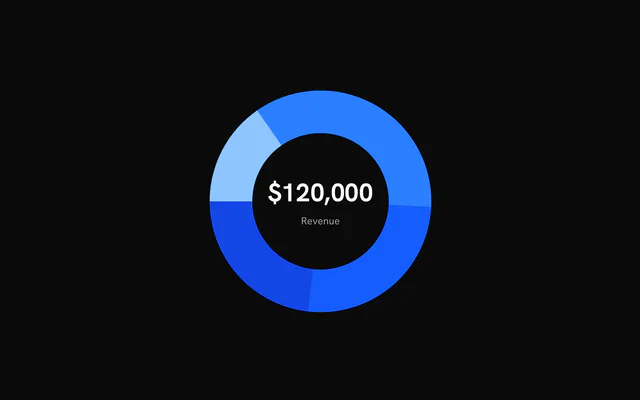
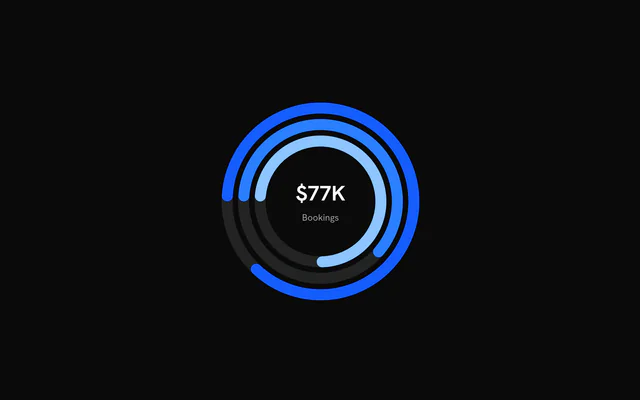
- Ring chart6 examples
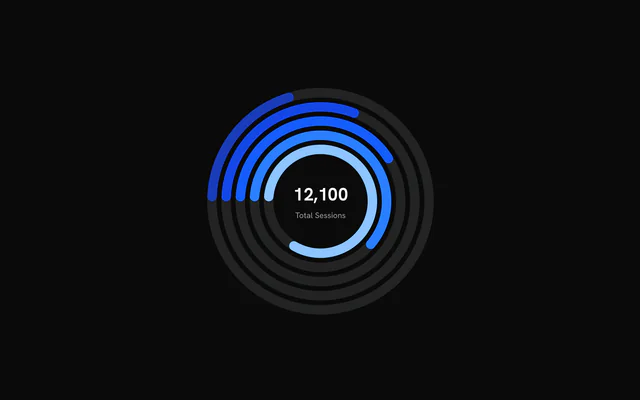
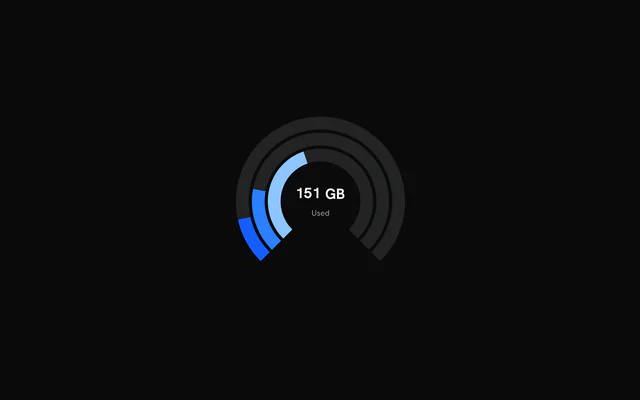
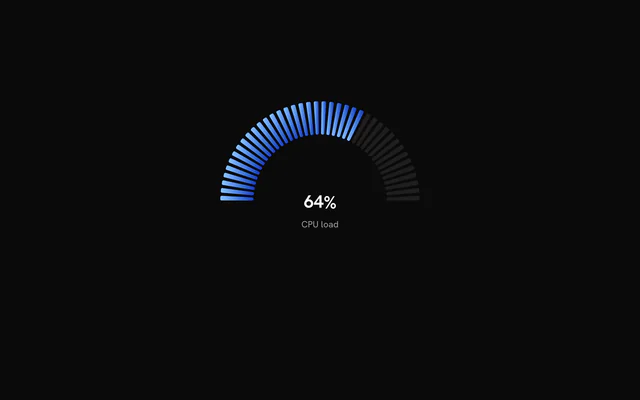
- Gauge21 examples
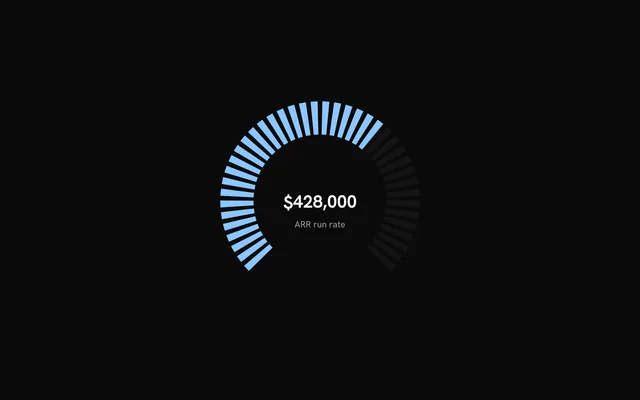
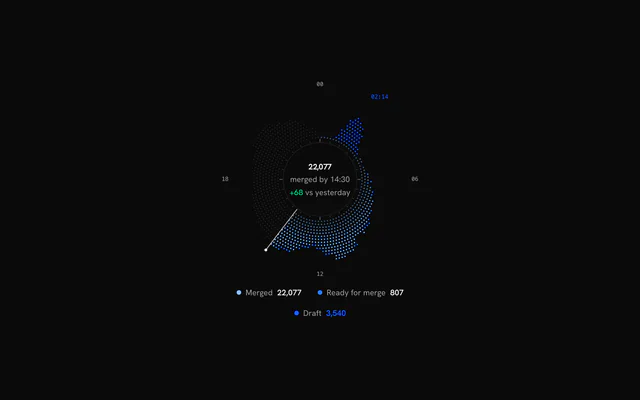
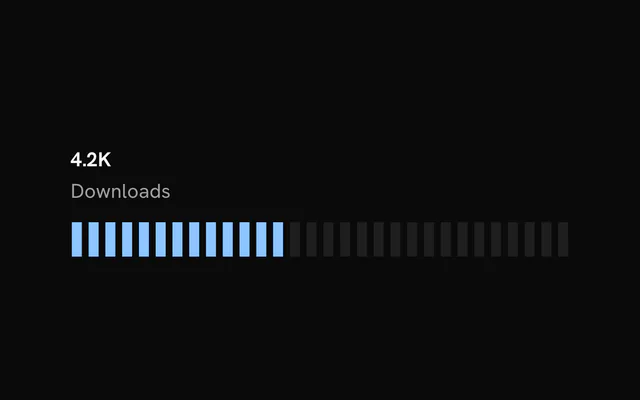
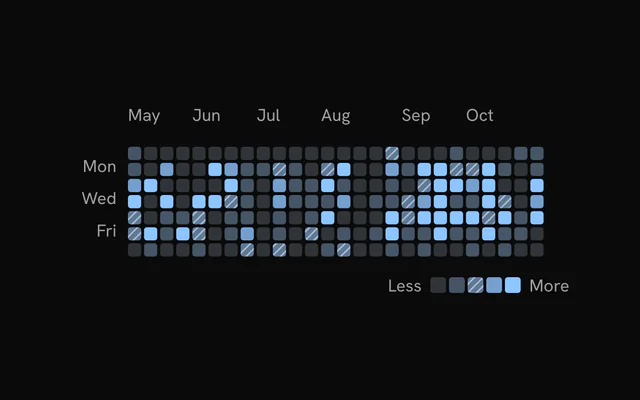
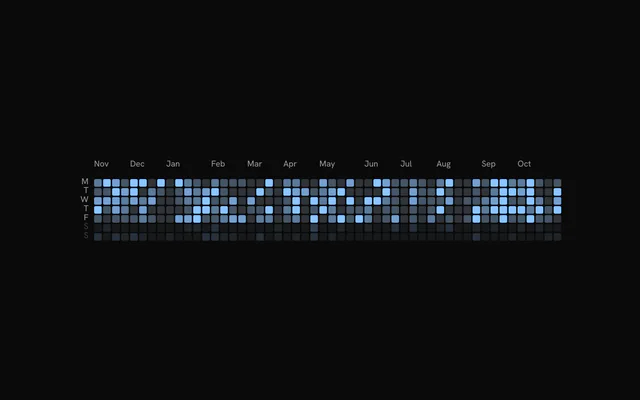
- Heatmap11 examples
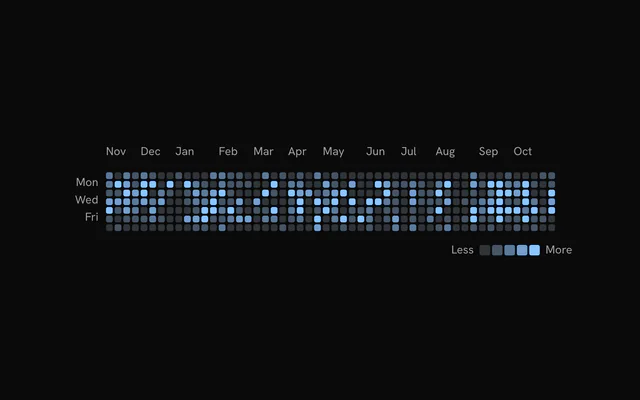
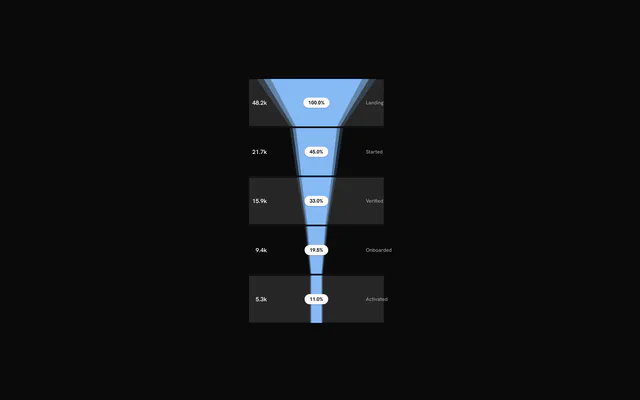
- Funnel chart11 examples
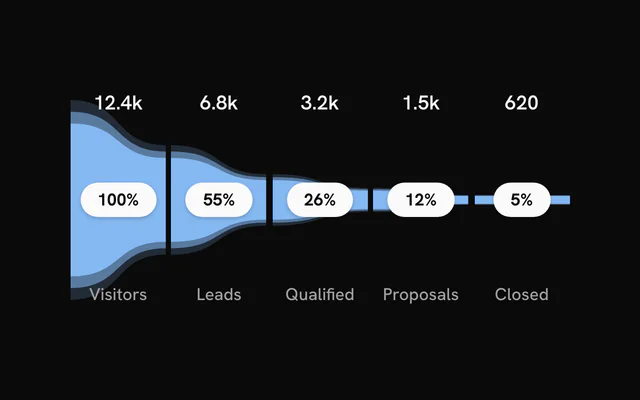
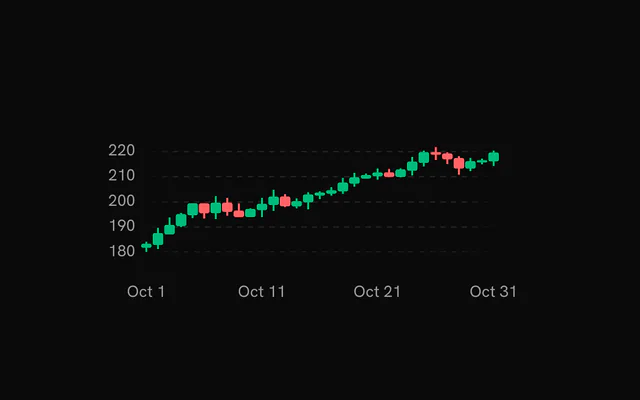
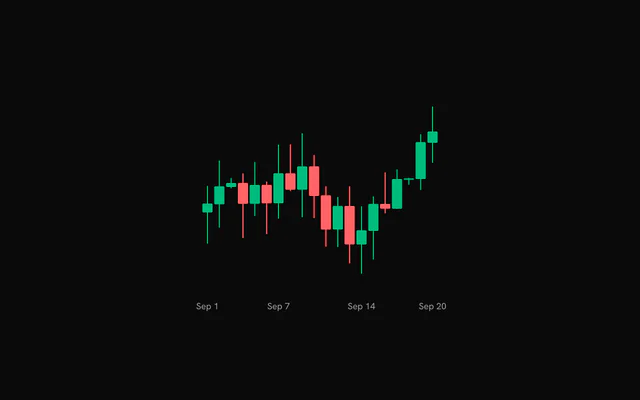
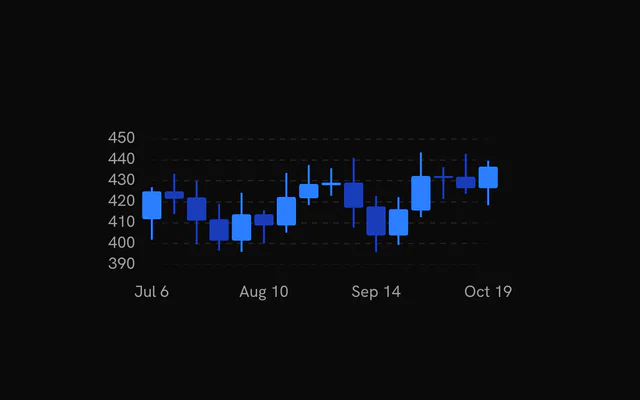
- Candlestick chart6 examples
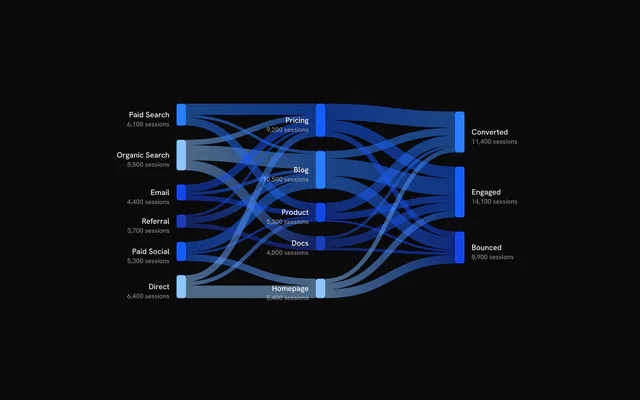
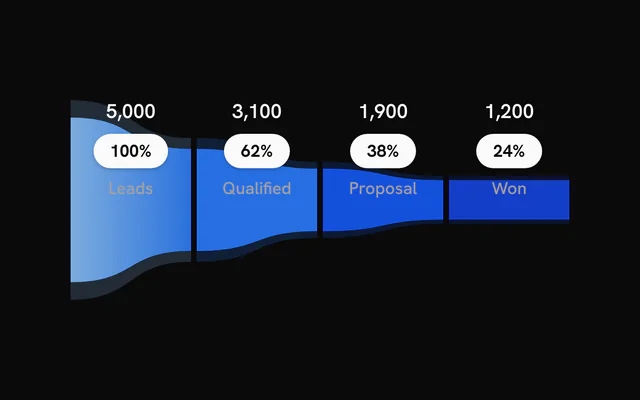
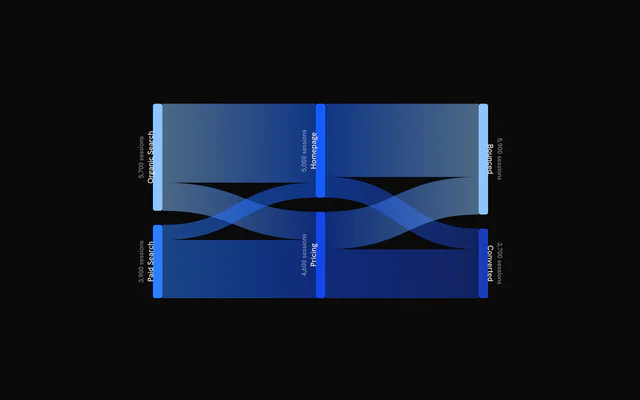
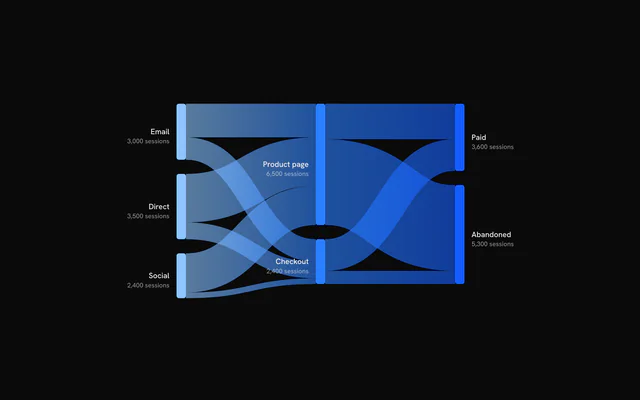
- Sankey diagram9 examples
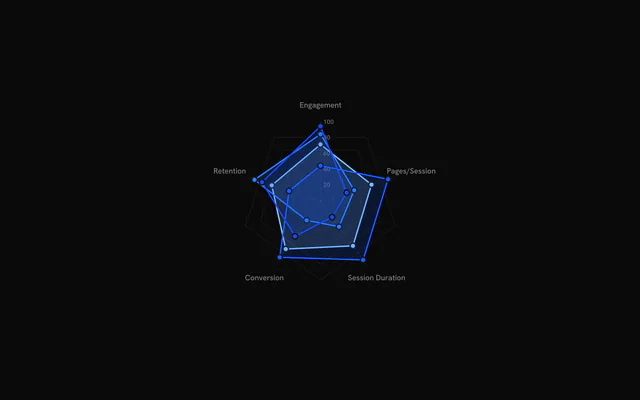
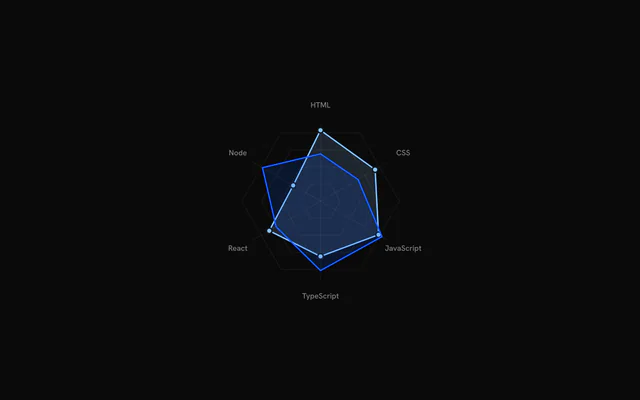
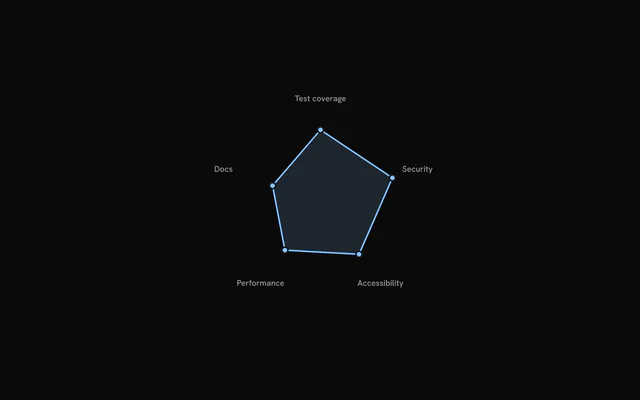
- Radar chart9 examples
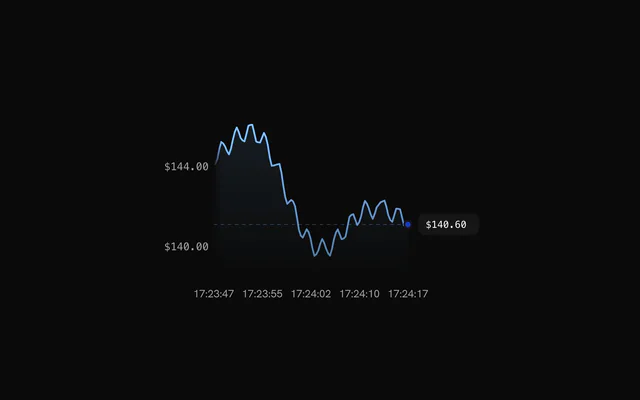
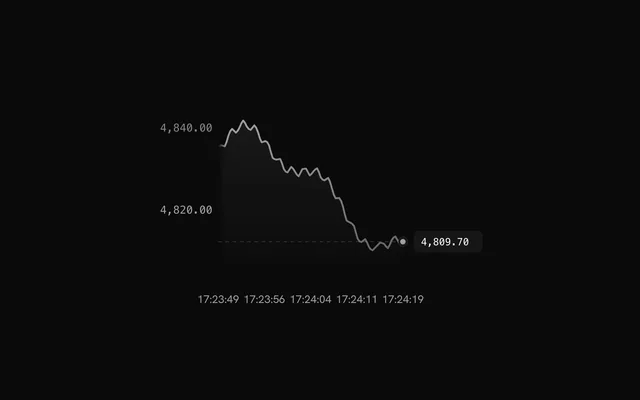
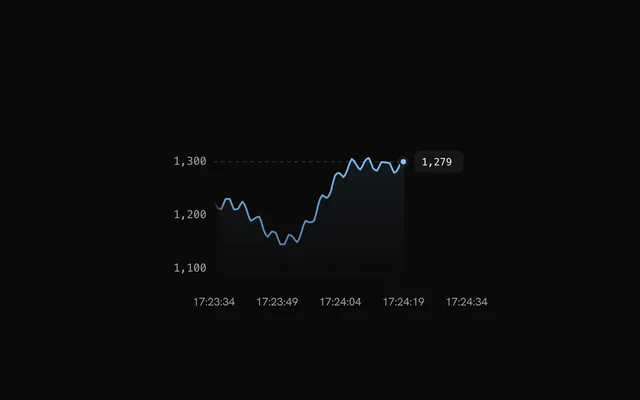
- Live line chart9 examples
- Composed chart11 examples
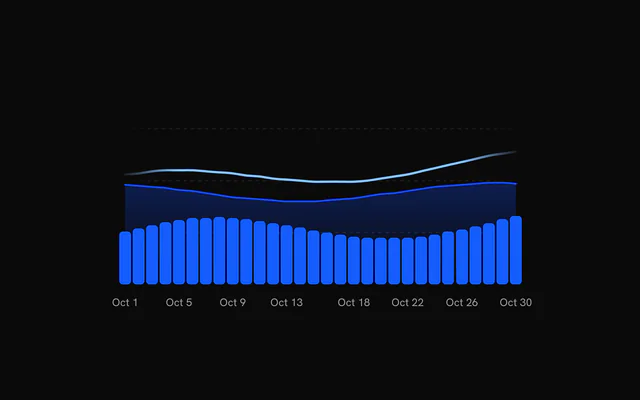
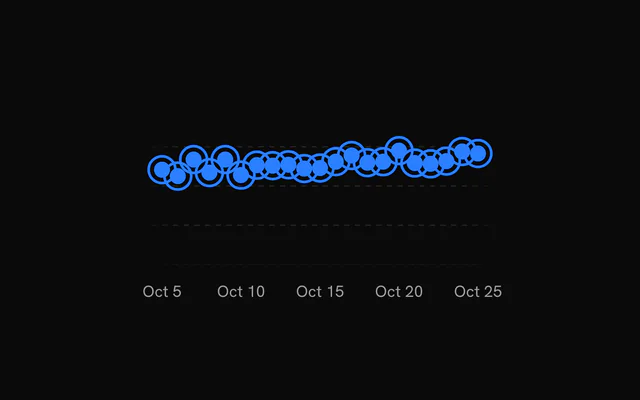
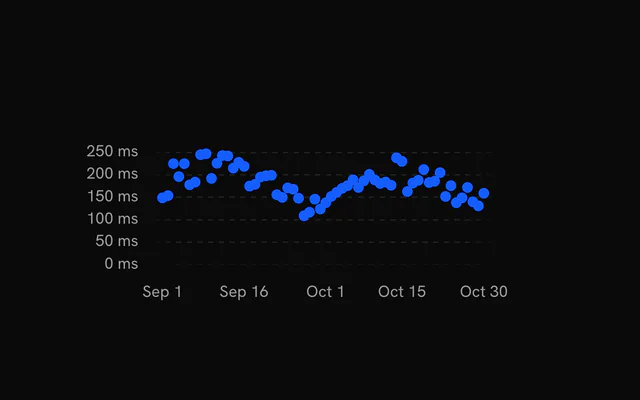
- Scatter chart6 examples
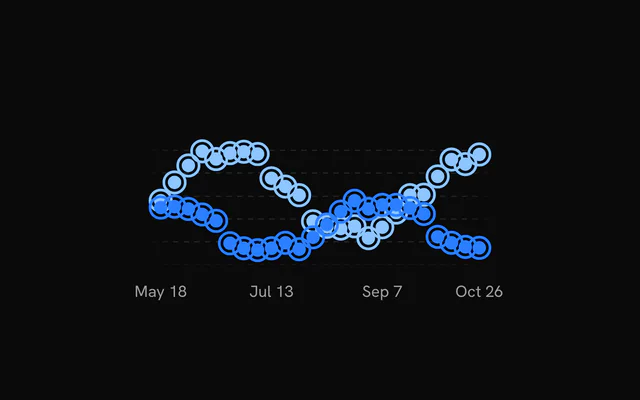
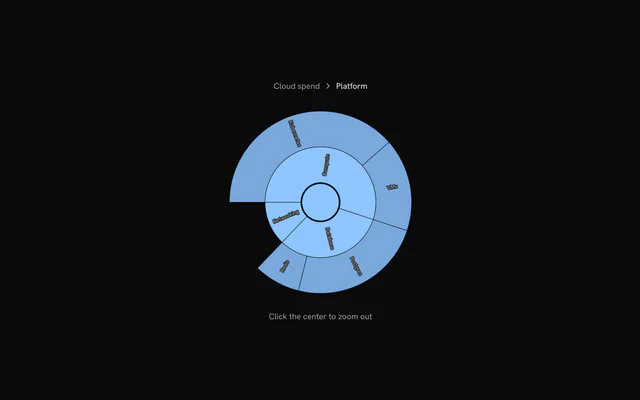
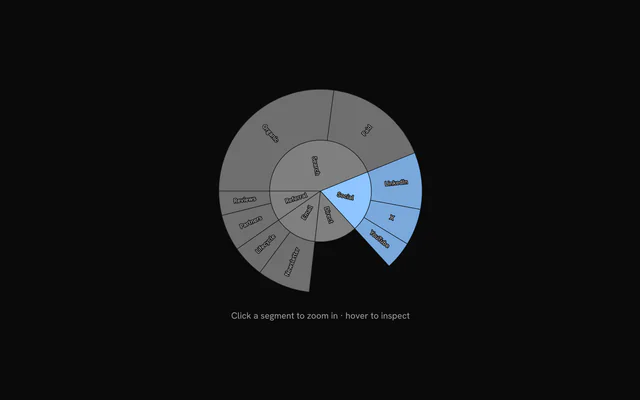
- Sunburst chart6 examples
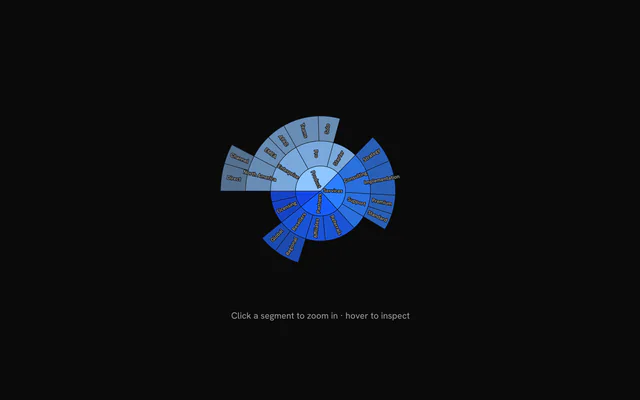
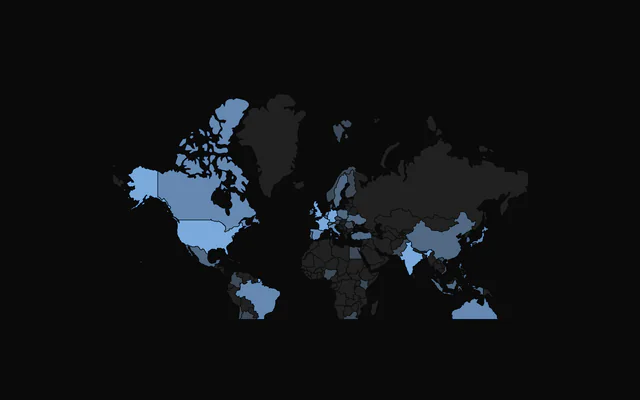
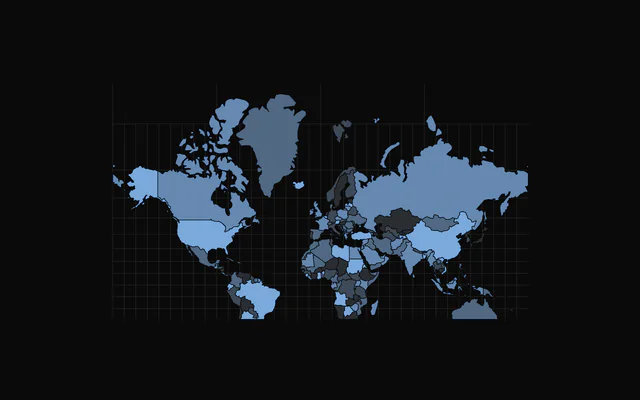
- Choropleth map9 examples
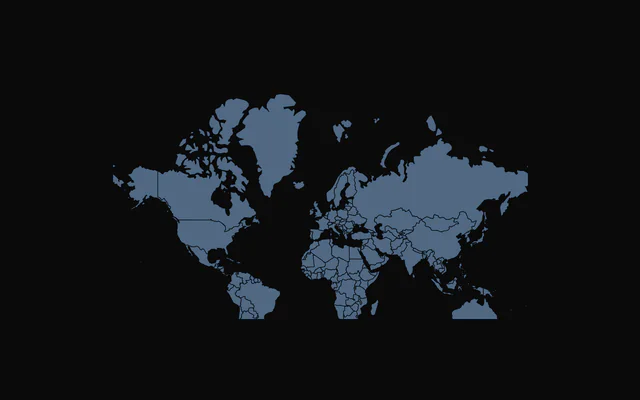
Need the page around it? With Pro, your AI agent installs dashboard, stats and monitoring blocks from a prompt, charts already laid out in them.
Get ProExamples by type
45 types, 330 examples. Each opens its gallery in Examples: every example of the type, with its code.
- Area chart examples20 examples
- Bar chart examples11 examples
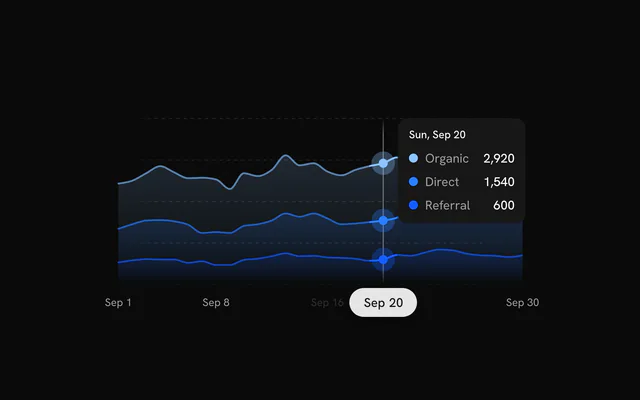
- Line chart examples41 examples
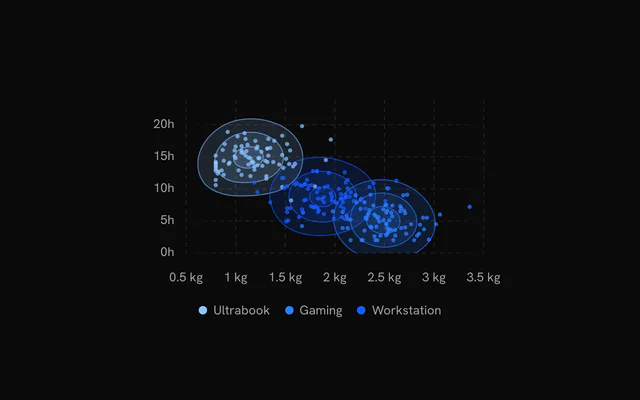
- Scatter chart examples6 examples
- Candlestick chart examples6 examples
- Composed chart examples11 examples
- Live line chart examples9 examples
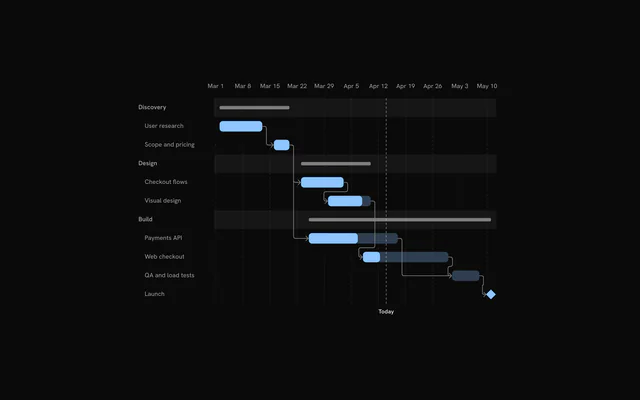
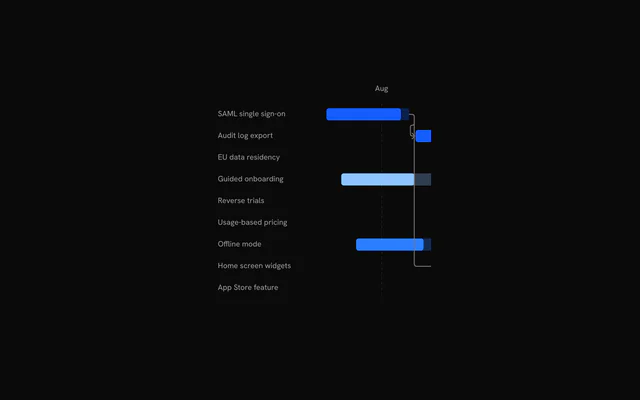
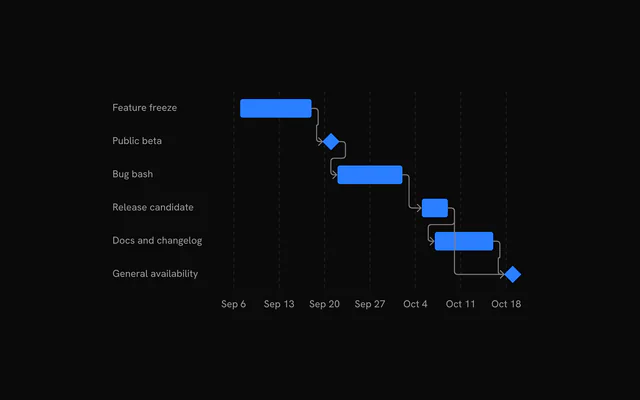
- Gantt chart examples4 examples
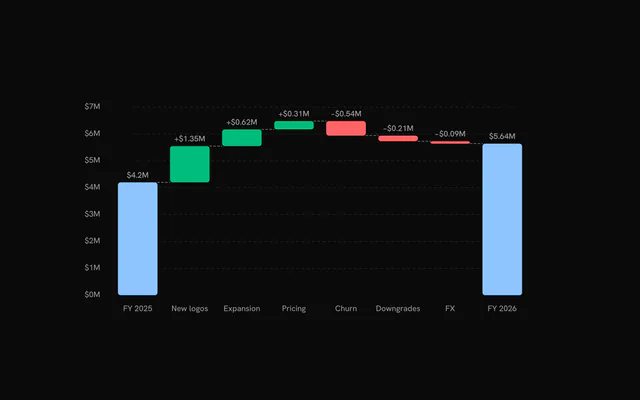
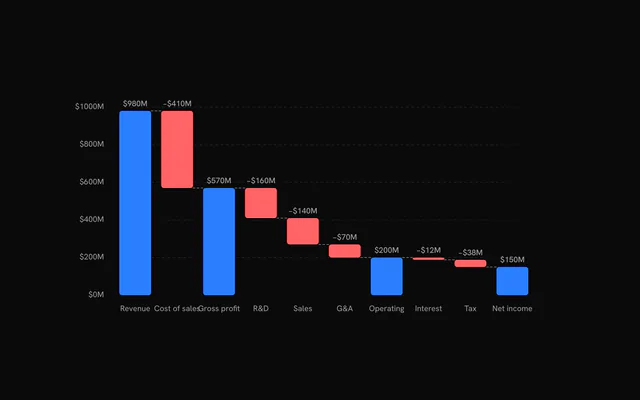
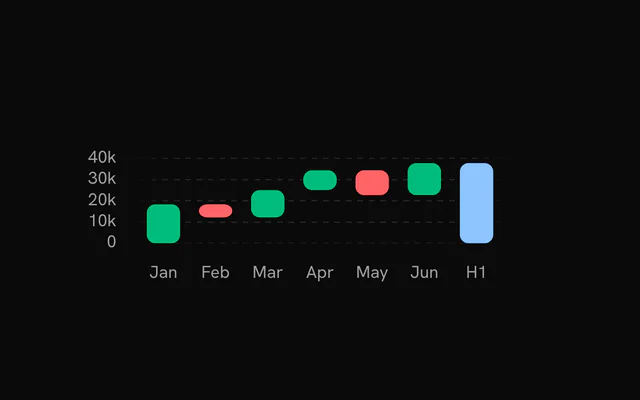
- Waterfall chart examples4 examples
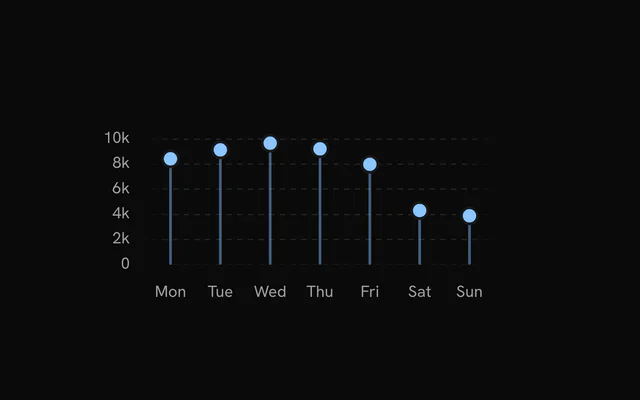
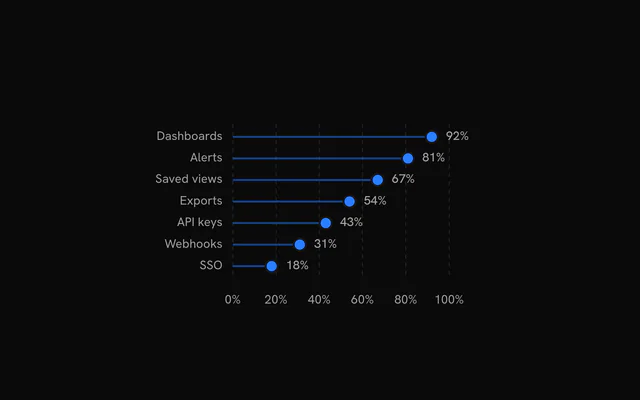
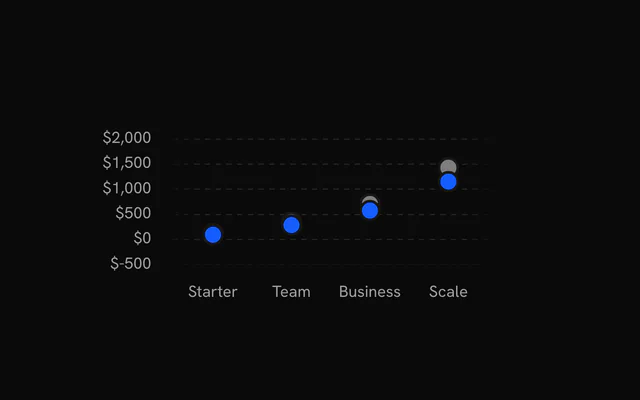
- Lollipop chart examples4 examples
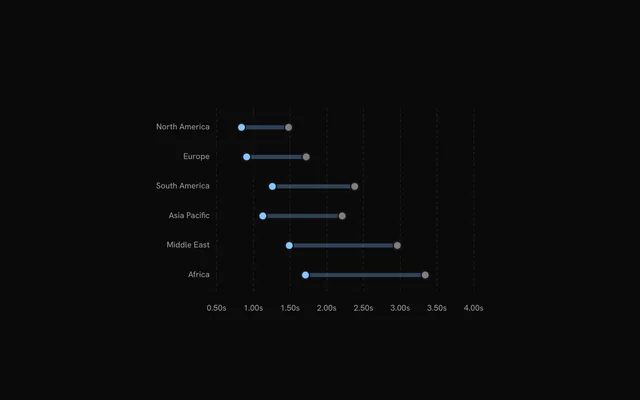
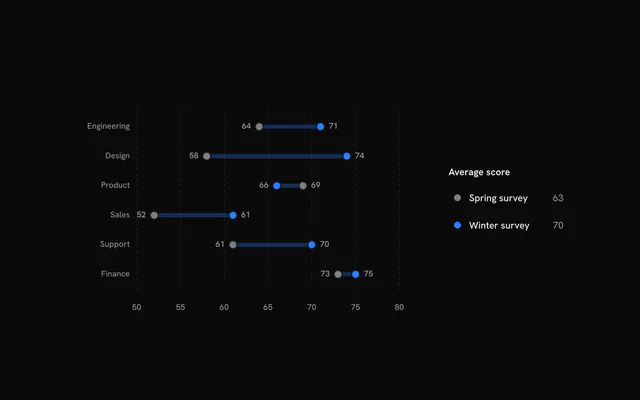
- Dumbbell chart examples4 examples
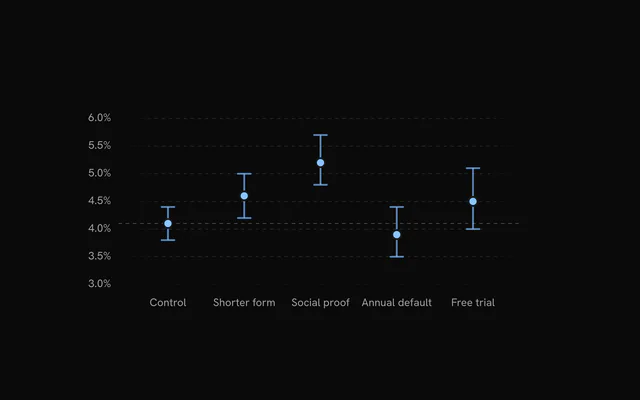
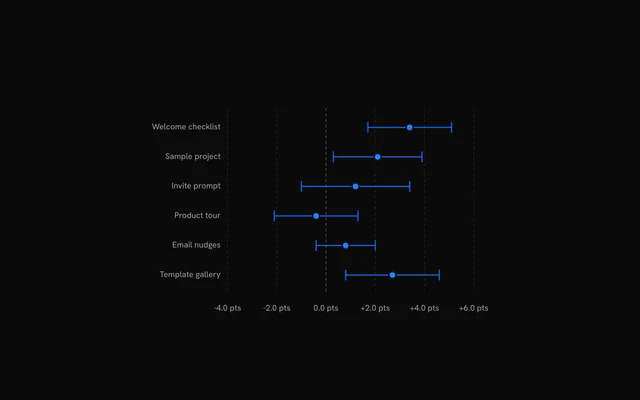
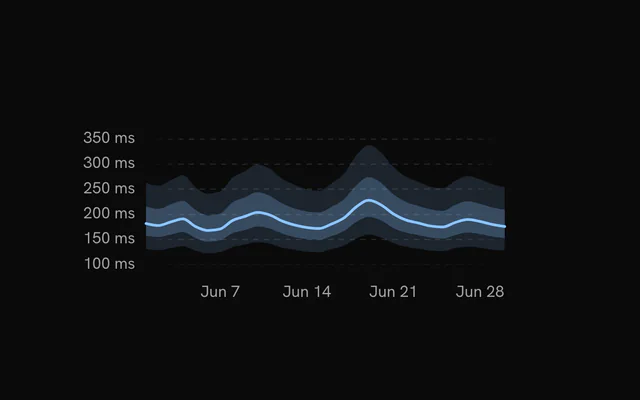
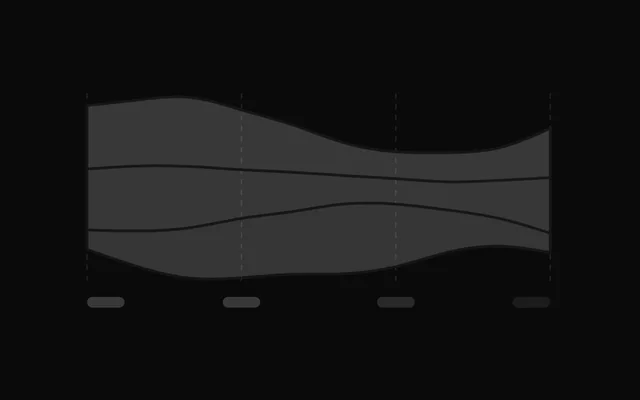
- Uncertainty chart examples5 examples
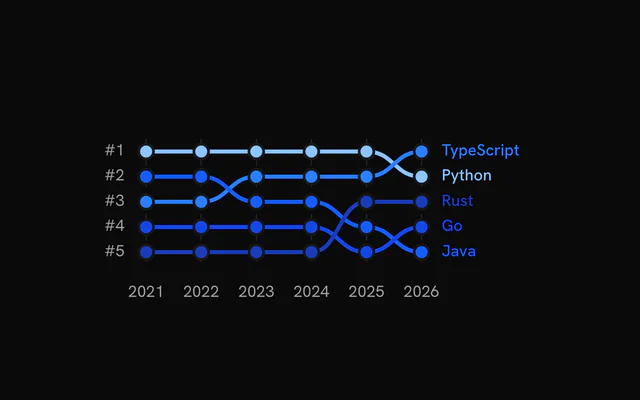
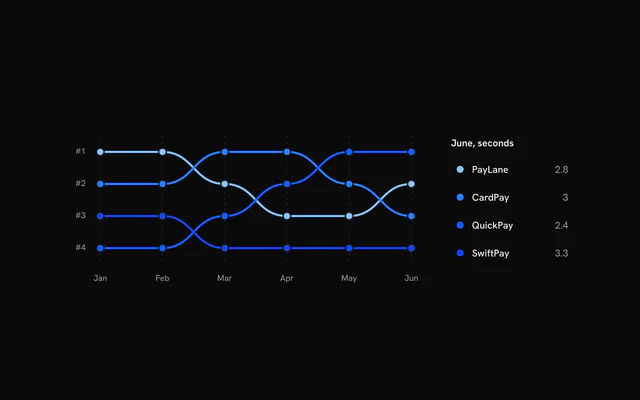
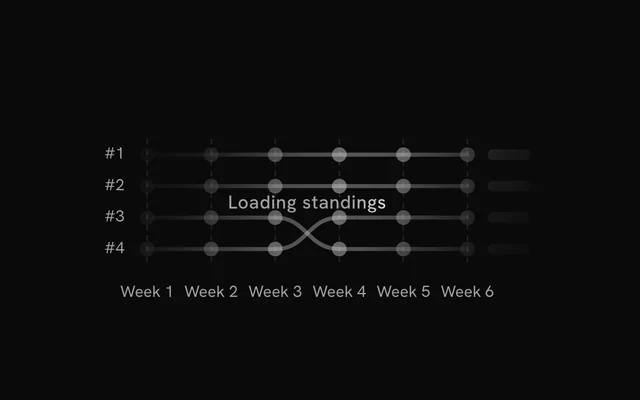
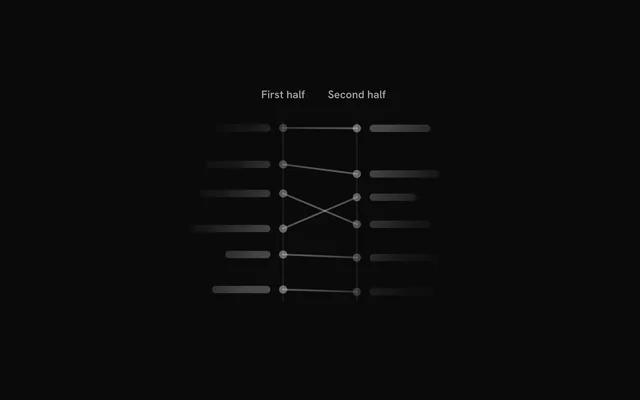
- Bump chart examples3 examples
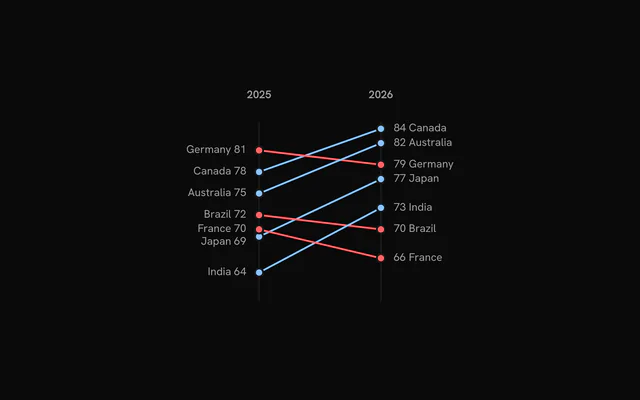
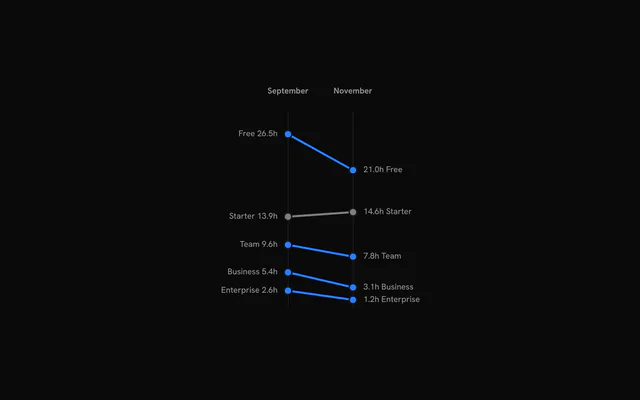
- Slope chart examples3 examples
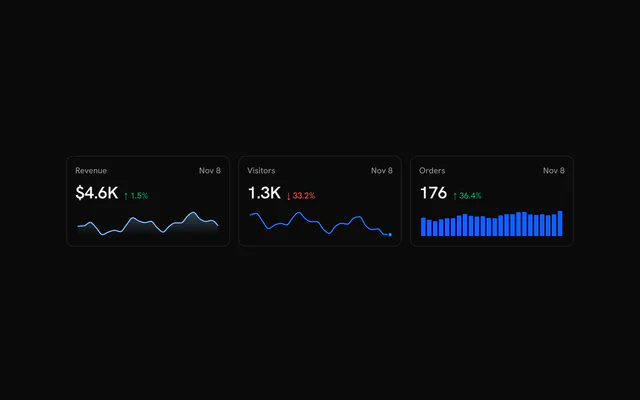
- Sparkline examples15 examples
- Pie chart examples14 examples
- Ring chart examples6 examples
- Radar chart examples9 examples
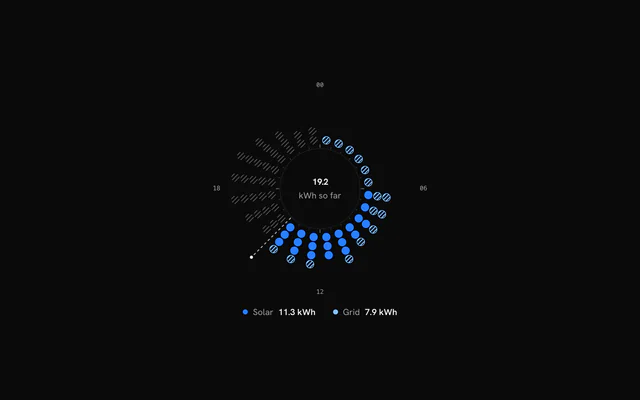
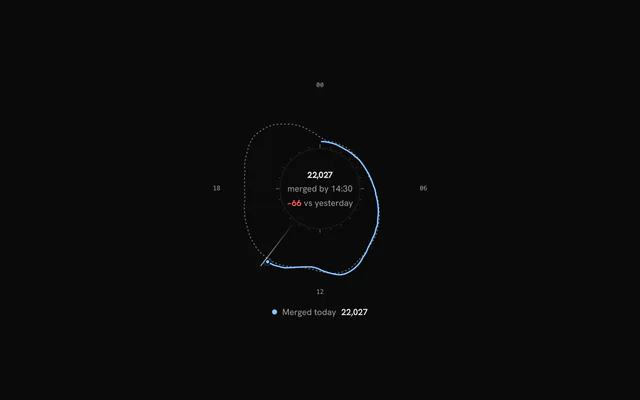
- Radial chart examples11 examples
- Gauge examples21 examples
- Funnel chart examples11 examples
- Heatmap examples11 examples
- Sunburst chart examples6 examples
- Sankey diagram examples9 examples
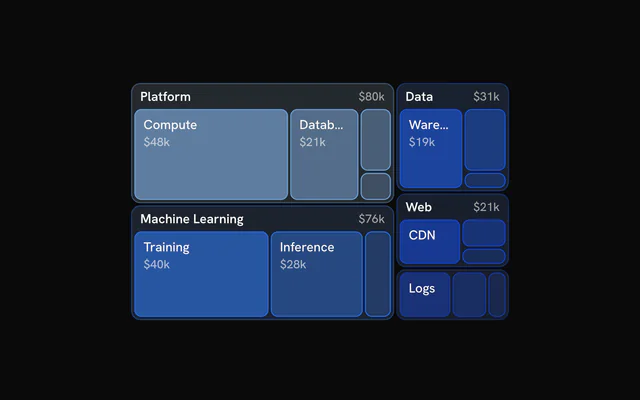
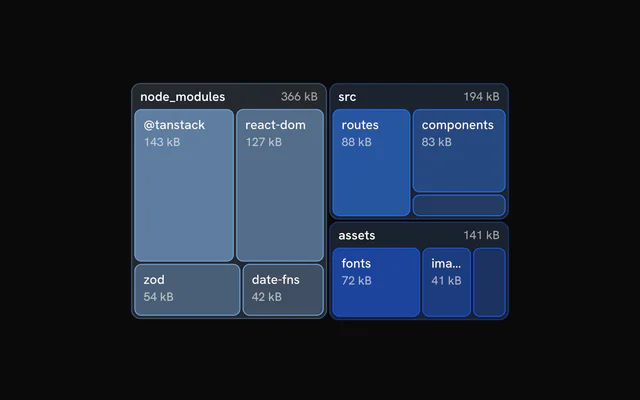
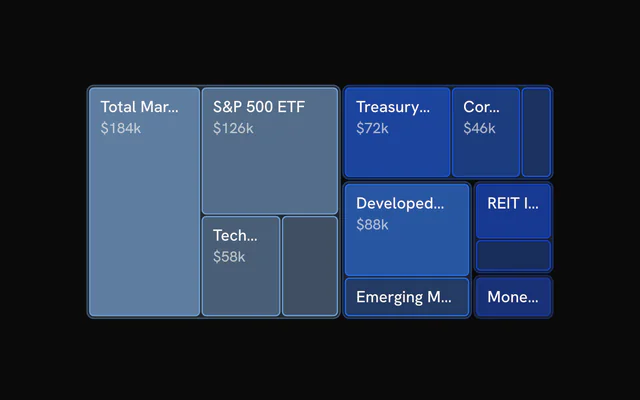
- Treemap examples4 examples
- Tree chart examples4 examples
- Network chart examples3 examples
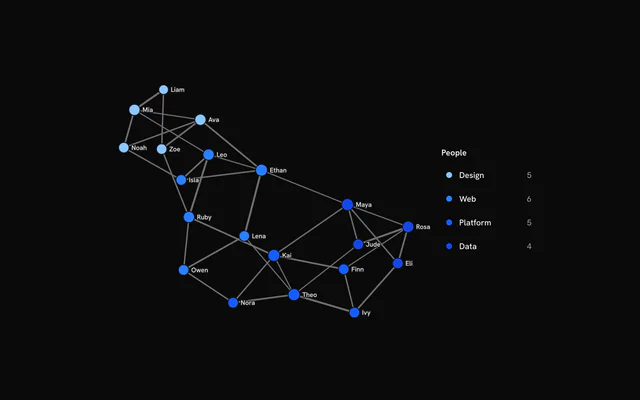
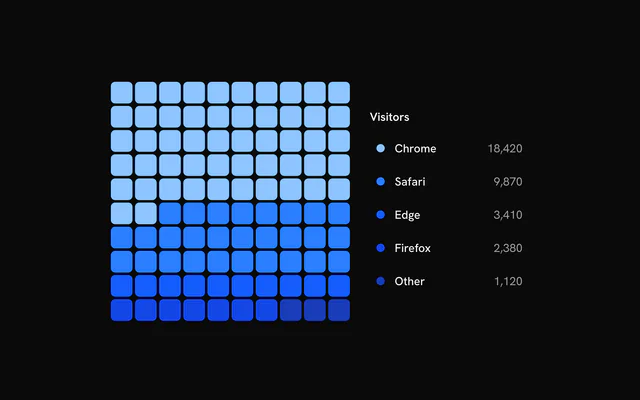
- Waffle chart examples4 examples
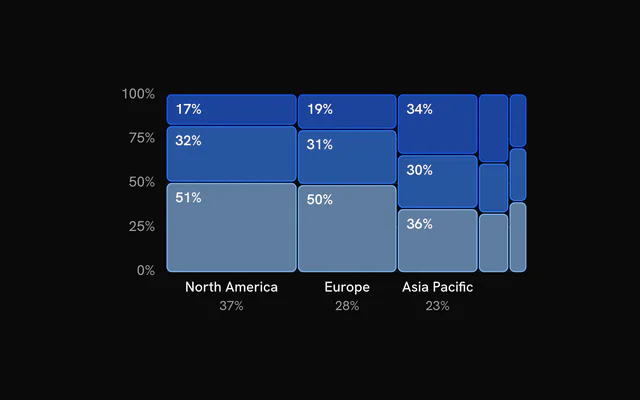
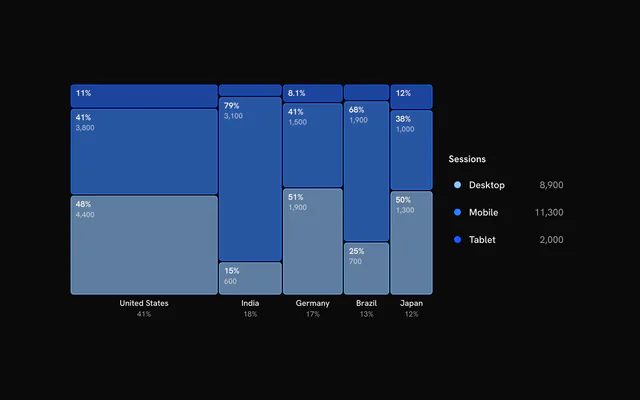
- Marimekko chart examples3 examples
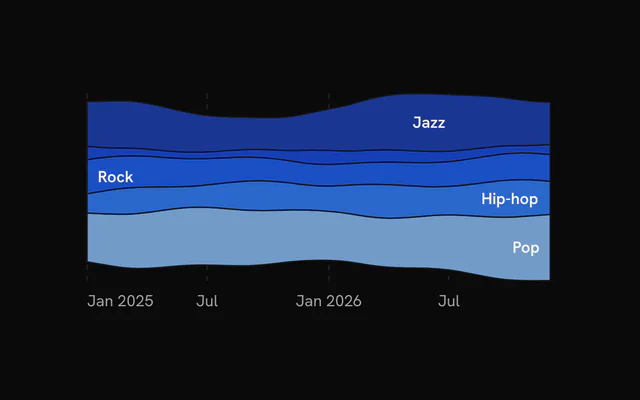
- Stream chart examples3 examples
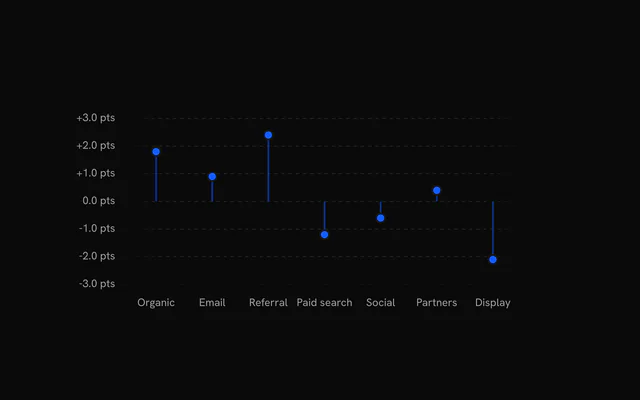
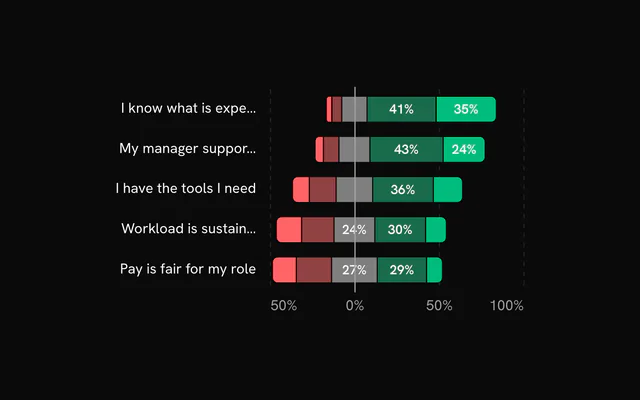
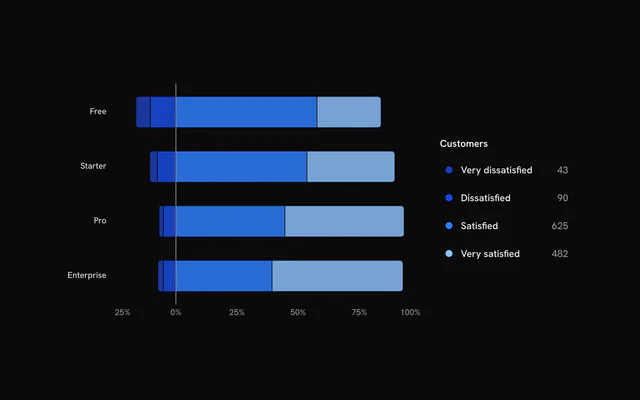
- Diverging bar chart examples3 examples
- Choropleth map examples9 examples
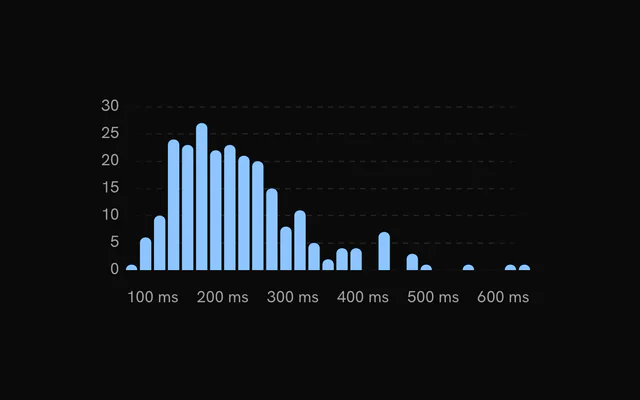
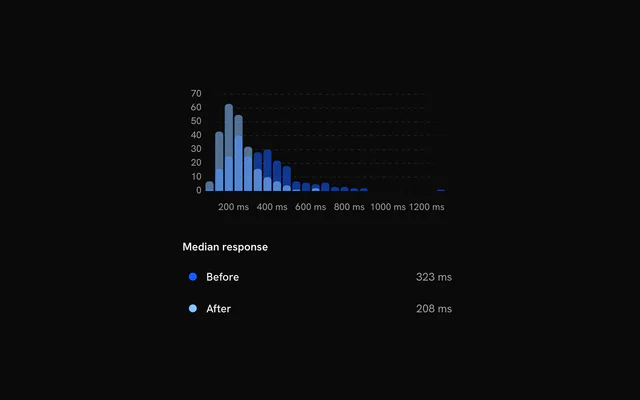
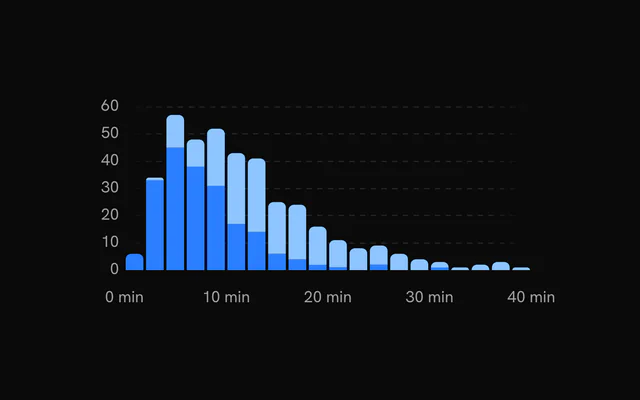
- Histogram examples4 examples
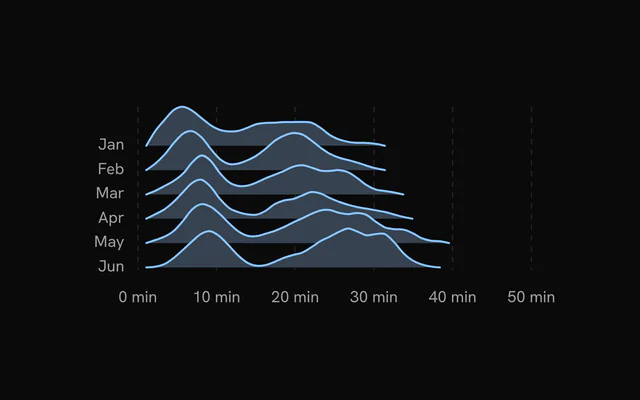
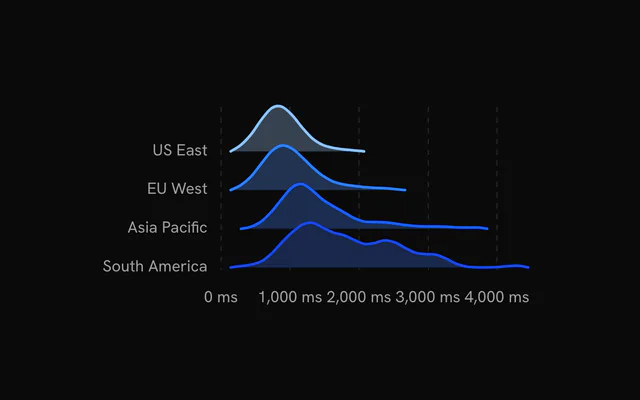
- Ridgeline plot examples3 examples
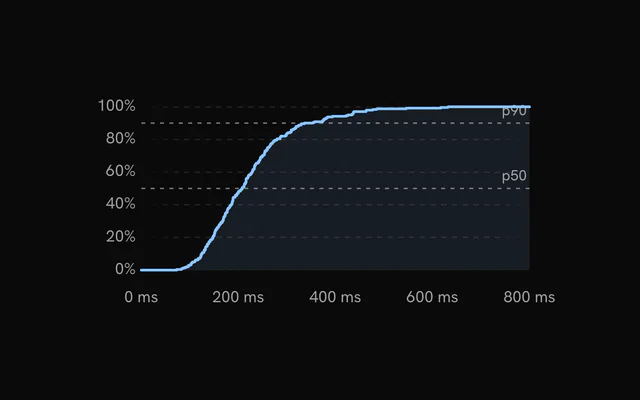
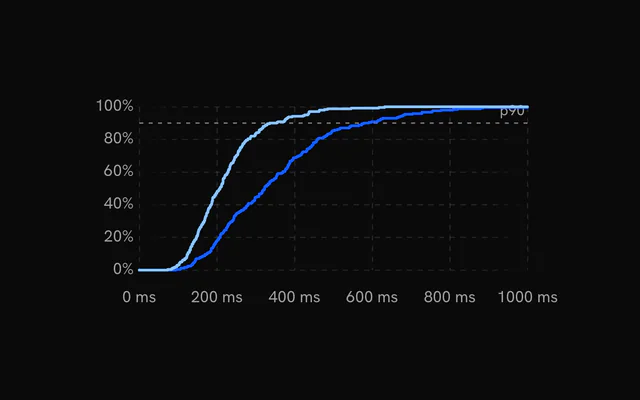
- ECDF chart examples3 examples
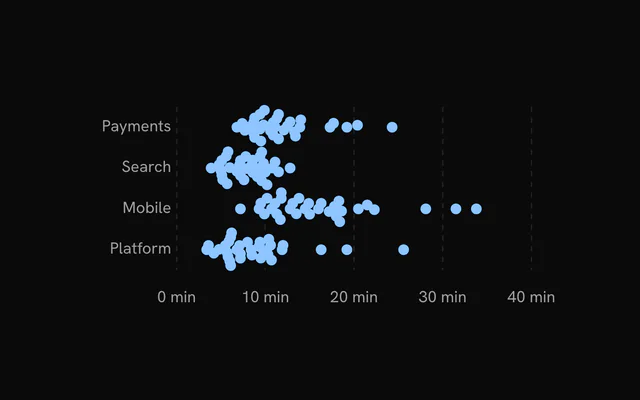
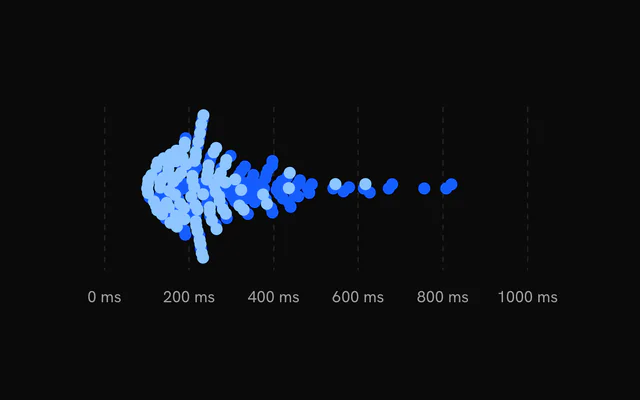
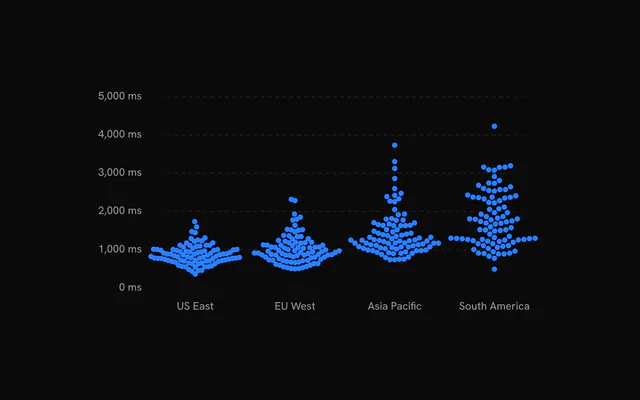
- Beeswarm chart examples4 examples
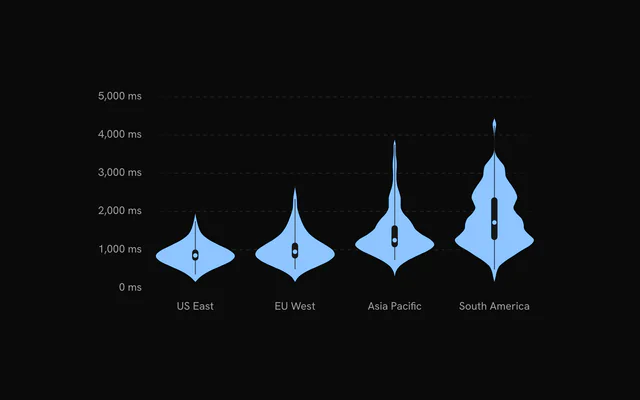
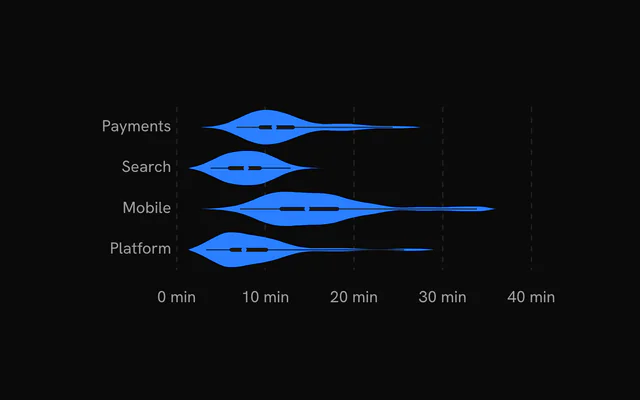
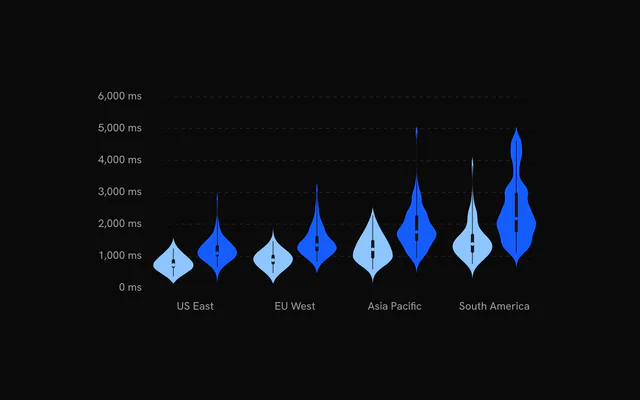
- Violin plot examples4 examples
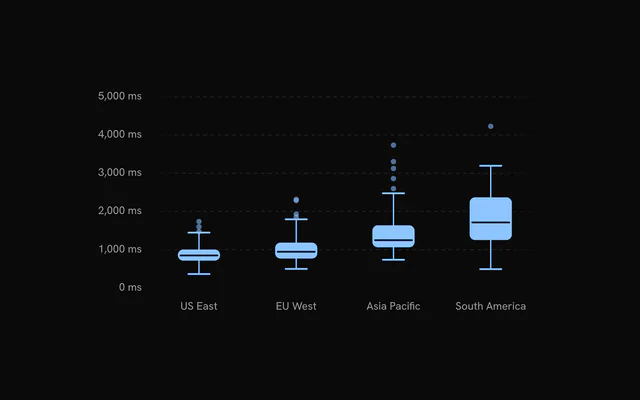
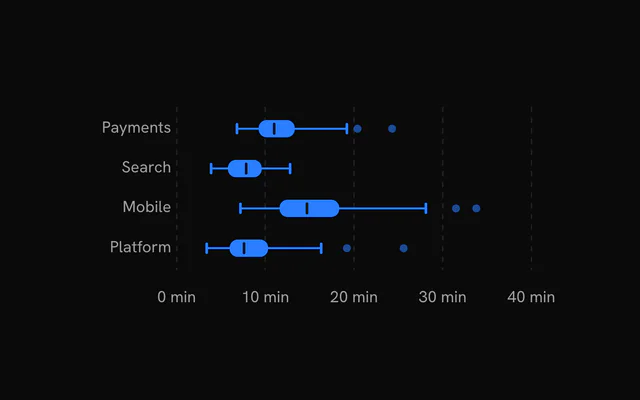
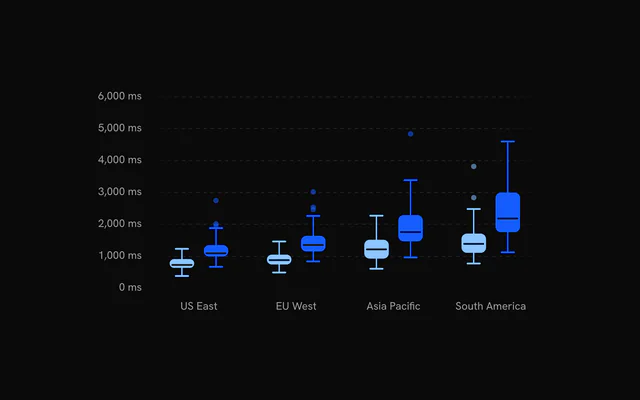
- Box plot examples4 examples
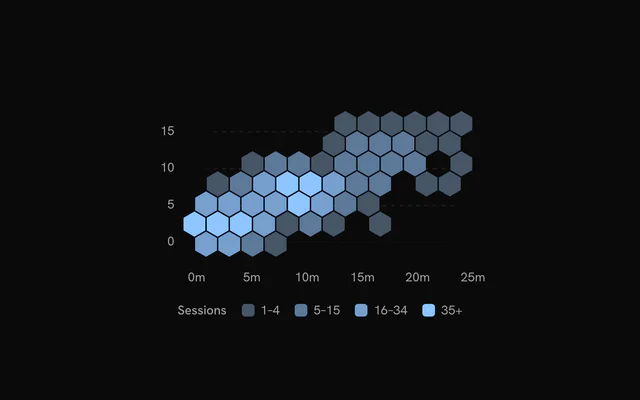
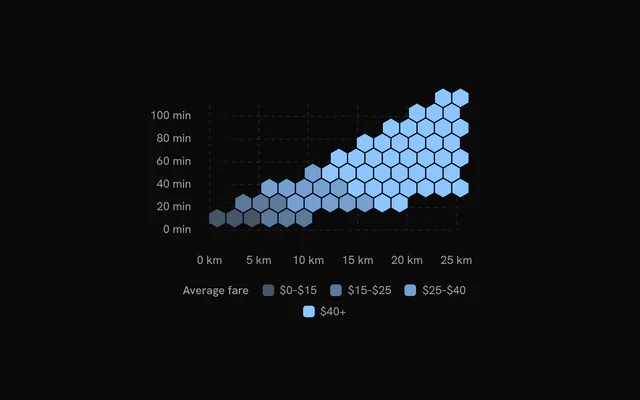
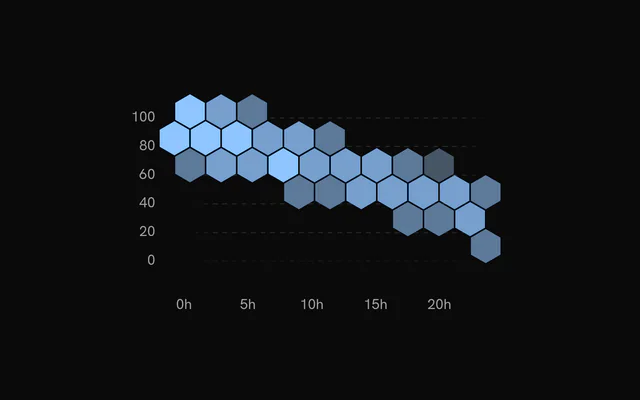
- Hexbin chart examples4 examples
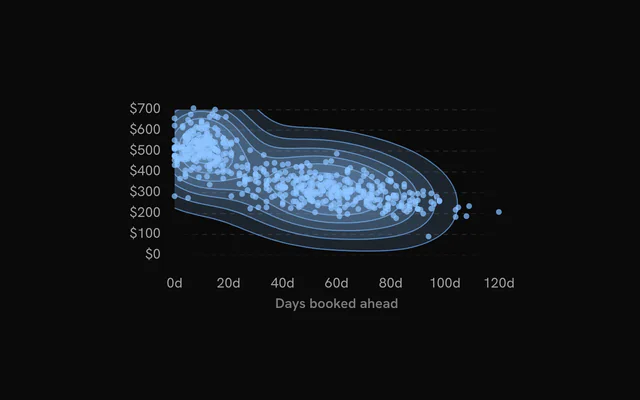
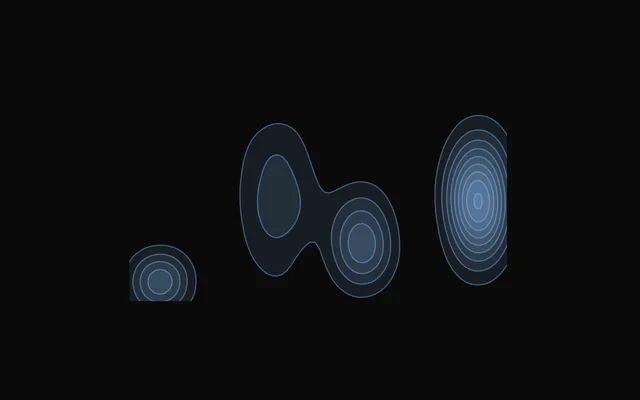
- Density chart examples4 examples
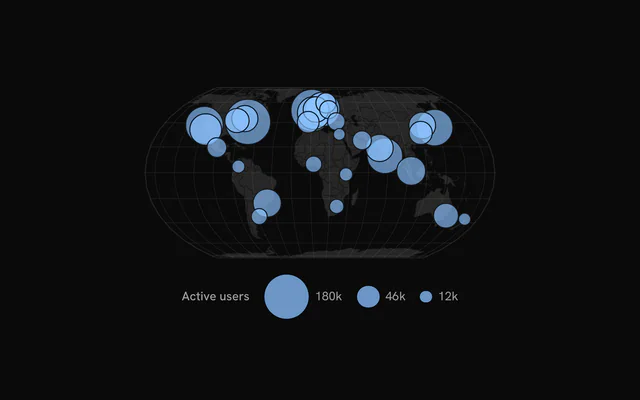
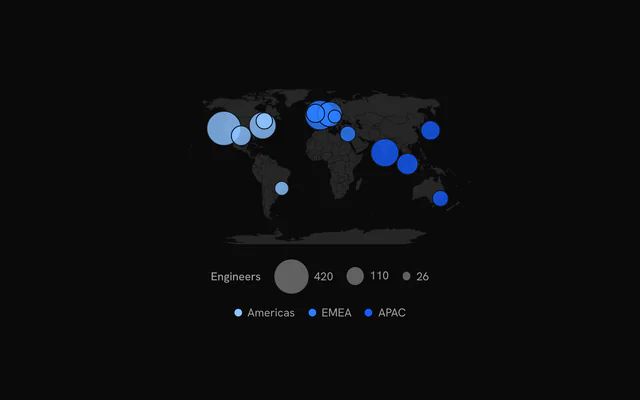
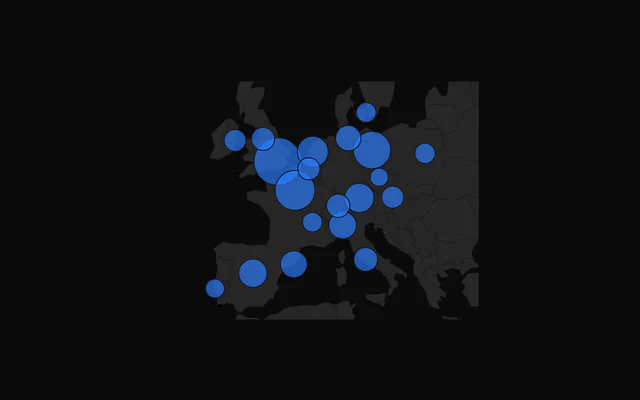
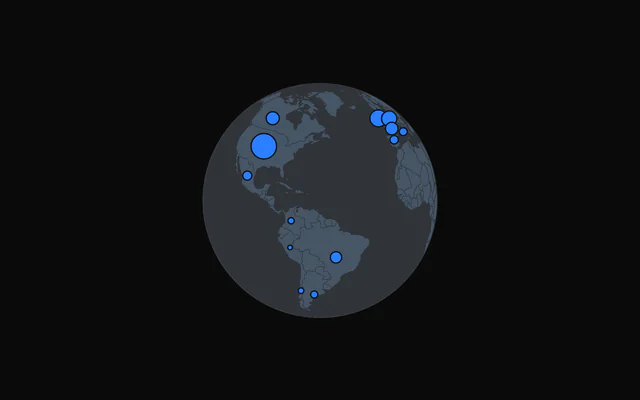
- Bubble map examples4 examples
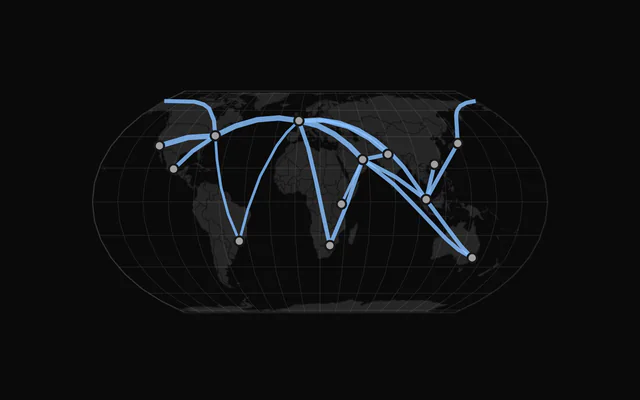
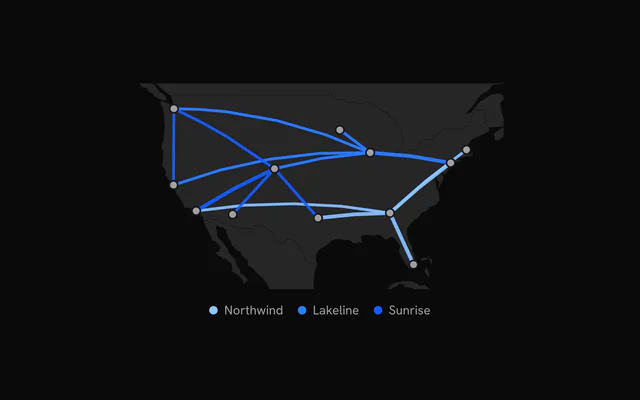
- Route map examples3 examples
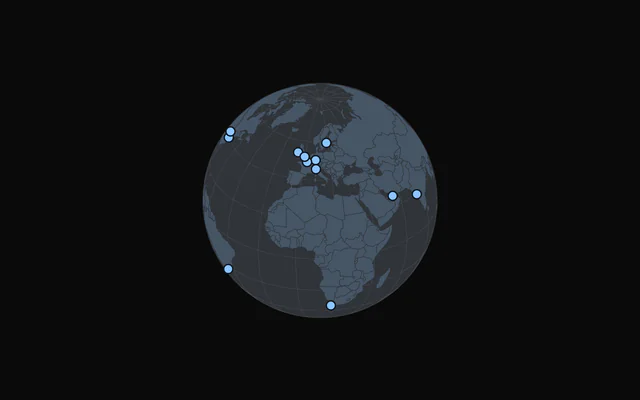
- Globe examples3 examples
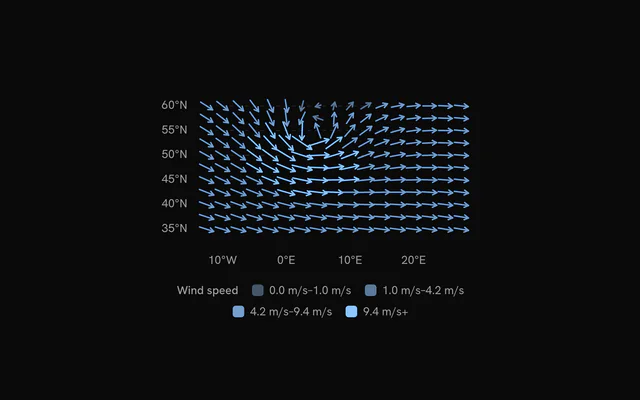
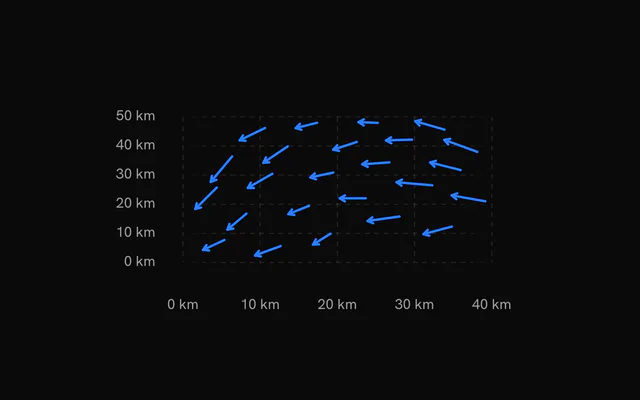
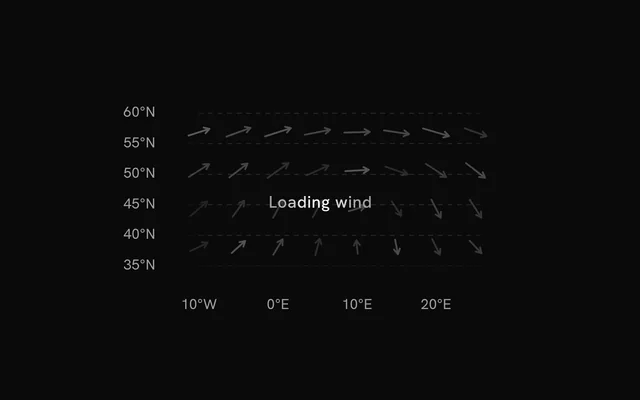
- Vector field examples3 examples
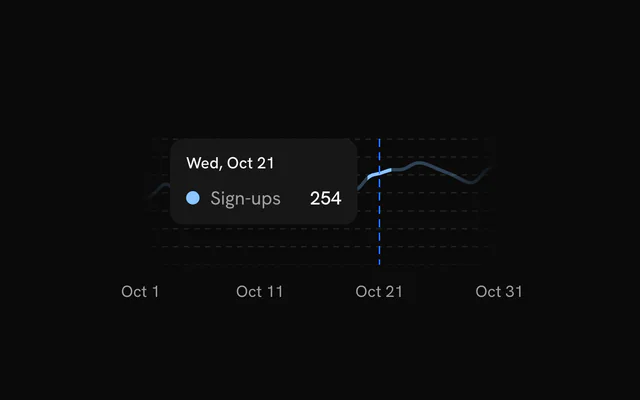
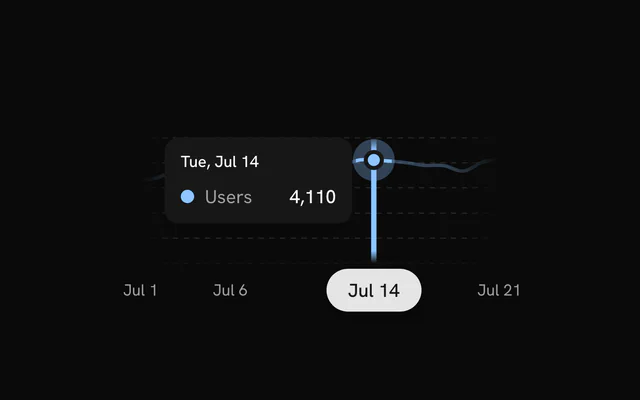
- Tooltip examples10 examples
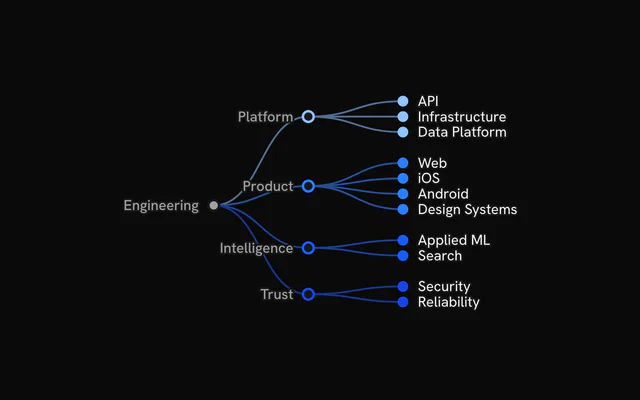
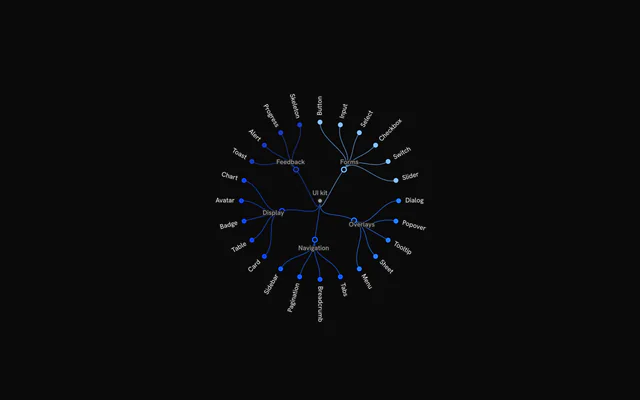
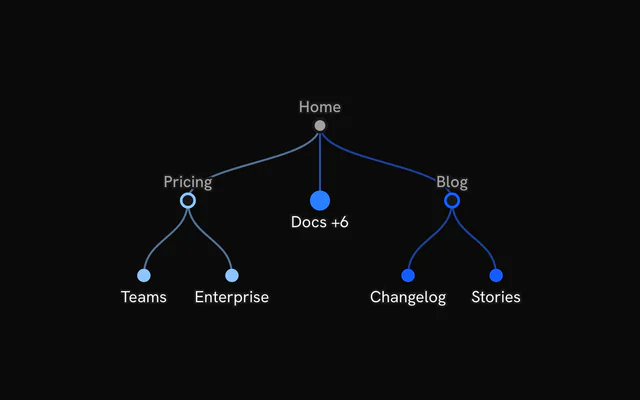
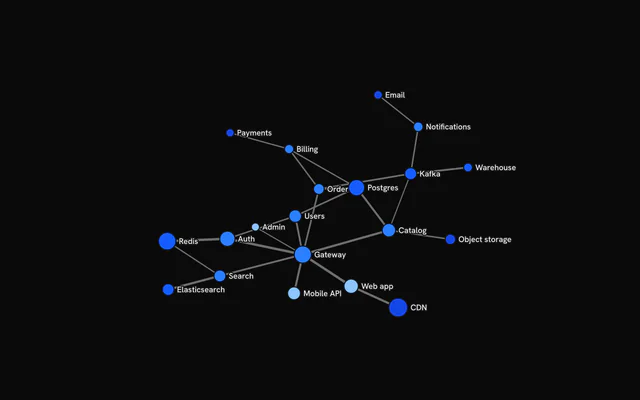



Charts in other frameworks
Charts on 3 more frameworks. The same chart types, each with its docs and examples written for that framework.
Pricing
Charts are free. Pro builds the rest of the page
All 330 charts are free with an account. Pro adds 6,000+ blocks, from dashboards to pricing, the Pro backgrounds, buttons, shaders and text effects, and the MCP that installs them from a prompt.
4.9/5 out of 5 · 150+ reviewsfrom 150+ founders and developers.
- Secure checkout via Stripe
- Code lives in your repo
- Keep what you've shipped if you cancel
- License terms
FAQ
Frequently asked questions
44 chart types, from line and bar charts to Sankey diagrams and maps, rebuilt from bklit-ui on TanStack Charts for Vue, with 330 examples. Each chart is a Vue single-file component, its parts the same as React's: a chart and the children that describe it.
They're bklit's charts (bklit-ui, MIT), rebuilt on TanStack Charts and drawn in shadcn/ui's tokens: `--chart-1` to `--chart-5` for the series, `--border`, `--muted-foreground` and `--popover` for the grid, the labels and the tooltip. They install the same way, as source in your project, and cover types shadcn/ui's own examples don't, such as gauges, funnels, heatmaps and Sankey diagrams.
Yes. Every chart is free to use in personal and commercial projects. Seeing the code and installing it takes a free account, one tap with Google or GitHub. Pro is the site's paid plan for blocks, the Pro collections and the MCP, and the charts don't need it.
Each chart is `role="img"` with a `chart` role description and the name you pass as `ariaLabel`, the card's title in every demo. It takes keyboard focus: Tab into it and the arrow keys, Home and End move along the data as hover does. Keep the card's title and description: they say what the chart compares, which the SVG can't.
Its renderer isn't tied to a framework, so one core in the kit drives the same charts in React, Vue, Svelte and Solid. A chart compiles its children (`<Line>`, `<Grid>`, `<XAxis>`, `<ChartTooltip>`) into one TanStack Charts definition and renders SVG that follows its container's width. Hover doesn't re-render your components: the focus is written to CSS variables, and the crosshair, dots and tooltip follow them.
Signed in, copy the chart's command: `npx shadcn-vue@latest add` with its URL. It adds the chart to `components/charts`, the `chart-kit` kit every chart imports, and `@tanstack/charts`. Import the chart and render it.
`@tanstack/charts` and `chart-kit`, the kit every chart imports: the chart components (`LineChart`, `PieChart`, `Gauge`…), the parts you put inside them, and the stylesheet that maps their colors to your theme's tokens. The card around each chart is our `card` component.
Not the charts themselves: the MCP server installs components, blocks and icons, and it has no chart tools. Copy a chart's command from its page and your agent can run it like any other. With Pro, the MCP installs the cards, selects and dashboard blocks you put the chart in.
Each series takes its color as a prop, `var(--chart-1)` to `var(--chart-5)` in every demo (`<Line stroke="var(--chart-1)">`), and the grid, labels, tooltip and focus ring read your theme's `--border`, `--muted-foreground`, `--popover` and `--ring`. Change a prop to recolor one chart, or the `--chart-N` tokens in your theme to recolor all of them.
Yes. Apart from `--chart-positive`, a fixed green, every color in the charts' stylesheet is one of your shadcn/ui tokens or a mix of them, so dark mode follows the `.dark` class and a preset restyles every chart at once.
4.9 out of 5 from 150+ developers


Every chart. One file each.
330 charts for Vue on TanStack Charts, free with an account. With Pro, your AI agent installs the blocks around them from a prompt.
Get Pro