shadcn.io is an independent project built on shadcn/ui
Installation
Overview
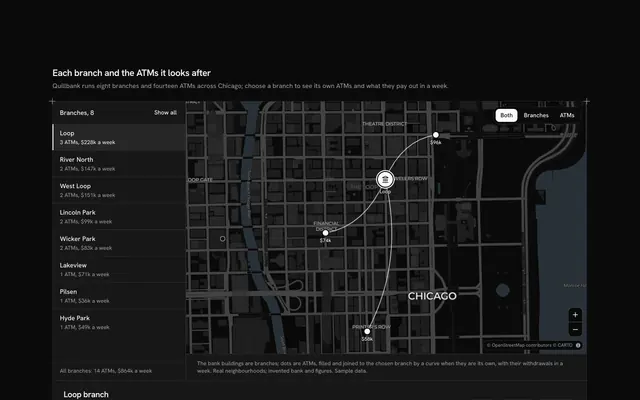
Show where your work has landed and what it adds up to, with this impact stats map for Solid with Ark UI. Hearthgrid, a solar mini-grid builder, has twelve mini-grids in towns and on islands across East Africa, from Gambela in Ethiopia to Ilha de Moçambique, each a circle at its real place on a live Map that follows your theme, light or dark, laid between the page's rails like any other section. A circle's area is true to the people its mini-grid serves, so a grid with twice the people has twice the ink, and a legend of three sizes reads them. The headline states the people they power, summed from the projects, and the one call to action is a Shine Button beside it. Pressing a circle, or a row of the compact list under the map (all twelve, most people first, each with its own small circle and its count), puts that project in the spotlight beside the list: its place and country, a sentence about it, its solar, homes and people, and the year it was switched on. Its circle fills dark with a sun in it and keeps its name. Under them a band of three figures, mini-grids running, people with power and megawatts of solar, counts up once with Counting Number as it scrolls into view. Built from Map, Shine Button, Counting Number and Guides. For climate and energy companies, nonprofits, foundations and anyone with a field programme to show.
FAQ
Where do the figures come from?
From the twelve projects typed in the file: each has its solar in kilowatts, its homes, its people and its year. The headline and the three figures are summed from them when the page loads, so changing a project changes every number that depends on it. The towns and their places are real; Hearthgrid, its projects and every figure are invented sample data, and nothing is fetched or sent.
When do the numbers count up?
Once, when the band of figures scrolls a quarter into view, racing off and slowing into the value over two seconds. Screen readers hear the value itself, never the count, and with reduced motion on the value shows at once.
How are the circles sized?
By area, not by width. Each circle's diameter is the square root of its people's share of the largest project's, so its area grows in step with the people it serves: Gambela's 21,600 people get a circle with about four times the area of Likoma Island's 5,200, and so about twice its width; a circle four times as wide would hold sixteen times the area and overstate it. The legend's three circles, for 5,000, 10,000 and 20,000 people, use the same rule, and the list repeats every count in figures.
How do I choose a project?
Press its circle on the map or its row in the list under the map, which ranks all twelve by people served. The chosen circle fills dark with a sun in it and keeps its name beside it, the row is marked, and the spotlight beside the list shows its story and figures; the other circles show their name and people while a pointer rests on them. A polite message reads the chosen project once you stop.
Can I use it without a mouse?
Yes. Every project is a button in the list under the map, which says which one is chosen, and the Shine Button is a link. The map takes the arrow keys and plus and minus once focused, with zoom buttons in its corner, and every fact a circle shows is also in the list and the spotlight.
How does it look on a phone?
The header and its button come first, then the map with smaller circles, the legend in a row under it, the spotlight, the list in one column and the three figures, one under another. Scrolling the page over the map scrolls the page: two fingers pan it. On wider screens the legend floats at the bottom start of the map, the camera keeps the circles clear of it, and the list takes two columns beside the spotlight.