shadcn.io is an independent project built on shadcn/ui
Installation
Usage
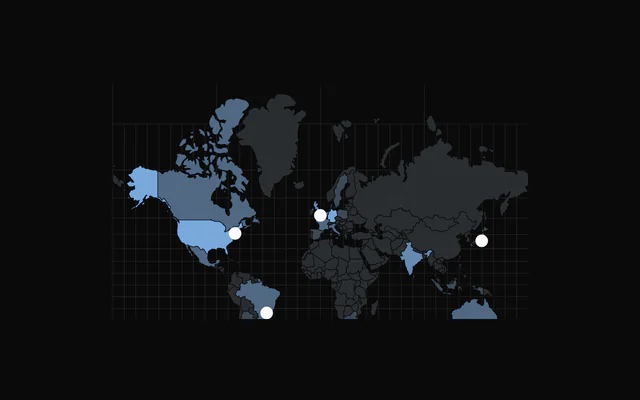
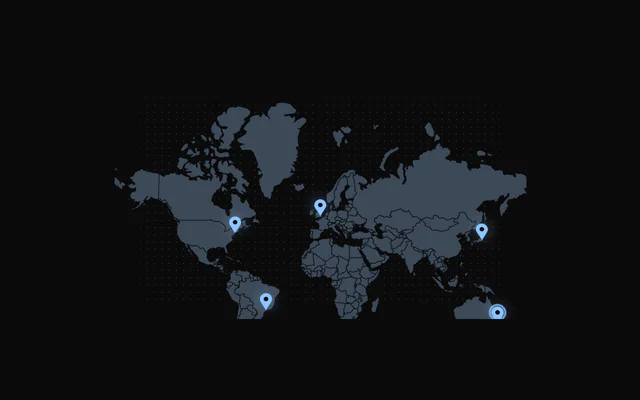
import { ChartChoroplethDotGrid } from "@/components/charts/chart-choropleth-dot-grid";<ChartChoroplethDotGrid />API Reference
ChoroplethChart
dataFeatureCollection<Geometry, ChoroplethFeatureProperties>
GeoJSON FeatureCollection to draw, with one feature per region. Pass GeoJSON objects: TopoJSON is not read, so convert it first (for example with topojson-client's feature()).
- Type
FeatureCollection<Geometry, ChoroplethFeatureProperties>
margin?Partial<Margin>
Chart margins in pixels. Any side you omit keeps its default.
- Type
Partial<Margin>- Default
{ top: 0, right: 0, bottom: 0, left: 0 }
animationDuration?number
Duration of the enter animation in milliseconds.
- Default
800
enterTransition?EnterTransition
Enter transition (a spring or a cubic-bezier tween), in seconds.
- Default
a tween of `animationDuration` on the reveal curve
revealSignature?string
Changing this value replays the enter animation.
- Default
""
aspectRatio?string
Aspect ratio of the chart as "width / height".
- Default
"16 / 9"
scale?number
Projection scale of the Mercator projection. When omitted it follows the chart width.
center?[number, number]
Geographic center of the map as [longitude, latitude].
- Default
[0, 20]
translate?[number, number]
Pixel offset of the projection center as [x, y]. When omitted the map is centered in the chart.
zoomEnabled?boolean
Enable zoom and pan with the mouse wheel, pinch, and drag.
- Default
false
zoomMin?number
Minimum zoom scale.
- Default
0.5
zoomMax?number
Maximum zoom scale.
- Default
4
initialZoom?TransformMatrix
Initial zoom transform.
- Default
the identity transform (no zoom, no pan)
className?string
Additional class name for the chart container.
- Default
""
clickToZoom?boolean
Click a region or a marker to fly the camera to it; click it again, the empty map, or press Escape to fly back.
- Default
false
focusMaxZoom?number
Largest camera scale when it frames a region.
- Default
6
zoomTransition?ChoroplethZoomTransition
Duration and easing of the click-to-zoom flight and of the camera's angle changes.
- Default
{ duration: 700, ease: [0.83, 0, 0.17, 1] }
perspective?ChoroplethPerspective
A 3D camera: one view for the zoomed-out map and one for a focused region (for example flat, swinging to look from the east once you zoom in).
childrenReactNode
ChoroplethFeatureComponent or ChoroplethDotGrid, ChoroplethGraticule, ChoroplethMarker, ChoroplethBackground and ChoroplethTooltip to configure the map, plus any elements that call useChoropleth(), useChoroplethZoom() or useChoroplethCamera().
ariaLabel?string
Accessible label of the chart.
- Default
"Choropleth chart"
ariaDescription?string
Longer accessible description of the chart.
ChoroplethDotGrid
gap?number
Distance between dot centres in pixels.
- Default
7
dotSize?number
Dot diameter as a fraction of gap (0 to 1).
- Default
0.7
zoomDotSize?number
Dot diameter (a fraction of gap) at the camera's largest zoom: the dots grow toward it as the camera zooms in.
- Default
0.9
hideOceanOnFocus?boolean
Fade the ocean dots out while the camera is focused on a region.
- Default
true
lattice?ChoroplethDotLattice
The lattice: "hex" offsets every other row, "square" is a plain grid.
- Default
"hex"
showOcean?boolean
Draw the grid over the oceans too, so the whole map is one dot field.
- Default
true
oceanColor?string
Color of the ocean dots.
- Default
"var(--chart-scale-01)"
oceanOpacity?number
Opacity of the ocean dots.
- Default
0.55
oceanDotScale?number
Size of the ocean dots relative to the land dots.
- Default
0.55
edgeFade?number
Fade the grid out toward the map's edges, as a percent of its width and height per side; 0 keeps hard edges.
- Default
12
fill?string
One color for every region's dots. Takes precedence over getFeatureColor.
getFeatureColor?(feature: ChoroplethFeature, index: number) => string
Returns the dot color of a region.
- Type
(feature: ChoroplethFeature, index: number) => string
fadedOpacity?number
Opacity of the other regions while one is hovered.
- Default
0.4
ChoroplethMarker
coordinates[number, number]
Where the marker sits, as [longitude, latitude].
labelstring
Name shown in the tooltip (and beside the marker with showLabel).
shape?ChoroplethMarkerShape
The marker's shape.
- Default
"circle"
size?number
Size in pixels; it stays this size while the map zooms.
- Default
9
color?string
Fill color.
- Default
"var(--foreground)"
stroke?string
Outline color; without it the marker has no outline.
strokeWidth?number
Outline width in pixels (with stroke).
- Default
1.5
pulse?ChoroplethMarkerPulse
The ripple ring: off, while hovered or focused, or always. Reduced motion turns it off.
- Default
"hover"
glow?number
Blur of a soft outer glow, in pixels; 0 turns it off.
- Default
0
showLabel?boolean
Always draw the label beside the marker.
- Default
false
className?string
Additional class name for the marker's group.
ChoroplethTooltip
content?(props: { feature: ChoroplethFeature; index: number }) => ReactNode
Custom tooltip content for a feature. Replaces the default name and value.
- Type
(props: { feature: ChoroplethFeature; index: number }) => ReactNode
formatValue?(value: number) => string
Formats the value in the default tooltip.
- Type
(value: number) => string- Default
integer formatting
getFeatureName?(feature: ChoroplethFeature, index: number) => string
Returns the tooltip title of a feature.
- Type
(feature: ChoroplethFeature, index: number) => string- Default
the feature's `properties.name`, or "Feature <index>"
getFeatureValue?(feature: ChoroplethFeature, index: number) => number | undefined
Returns the value shown for a feature. When it returns undefined the value row is hidden.
- Type
(feature: ChoroplethFeature, index: number) => number | undefined
valueLabel?string
Label of the value row.
- Default
"Value"
className?string
Additional class name for the tooltip panel.
panelStyle?CSSProperties
Inline styles for the tooltip panel, for example a blur or border.
backgroundColor?string
Background color of the tooltip panel (a CSS variable or a color).
hideDelay?number
Grace period in milliseconds before the tooltip hides when the pointer leaves a feature for the sea or a border gap: a move onto the next feature within it carries the panel over instead of fading it out and back in.
- Default
120