shadcn.io is an independent project built on shadcn/ui
Installation
Usage
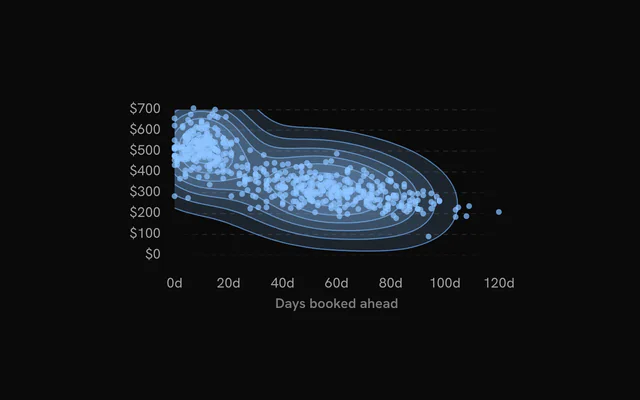
import { ChartDensityContours } from "@/components/charts/chart-density-contours";<ChartDensityContours />API Reference
DensityChart
datareadonly SpatialRow[]
The observations: one row per point. Rows without a finite x or y are left out.
xDataKeystring
Key of the horizontal value in each row.
yDataKeystring
Key of the vertical value in each row.
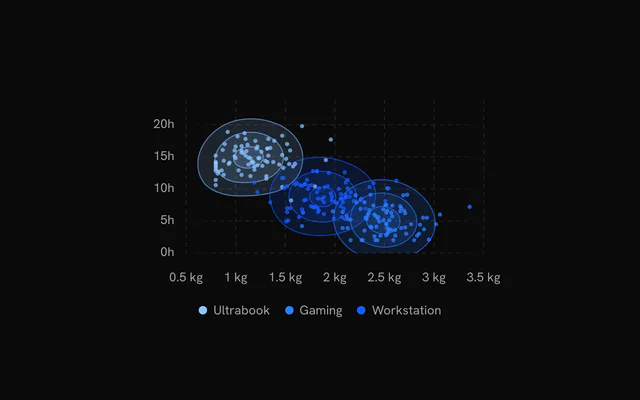
groupDataKey?string
Key of each row's group: each group gets its own density estimate and color (--chart-1, --chart-2… in order of appearance).
groupColors?Readonly<Record<string, string>>
Colors of the groups by name, over the palette.
- Type
Readonly<Record<string, string>>
xDomain?readonly [number, number]
The x range shown. Defaults to the data's, rounded out to nice values.
yDomain?readonly [number, number]
The y range shown. Defaults to the data's, rounded out to nice values.
aspectRatio?string
Aspect ratio of the chart as "width / height".
- Default
"16 / 9"
margin?Partial<SpatialMargin>
Space around the plot in pixels. Any side you omit keeps its default.
- Type
Partial<SpatialMargin>
animate?boolean
Play the entrance animation.
- Default
true
animationDuration?number
Length of the entrance sweep in milliseconds: the time from the first mark starting to the last one.
- Default
900
revealSignature?string
Changing this value replays the entrance animation.
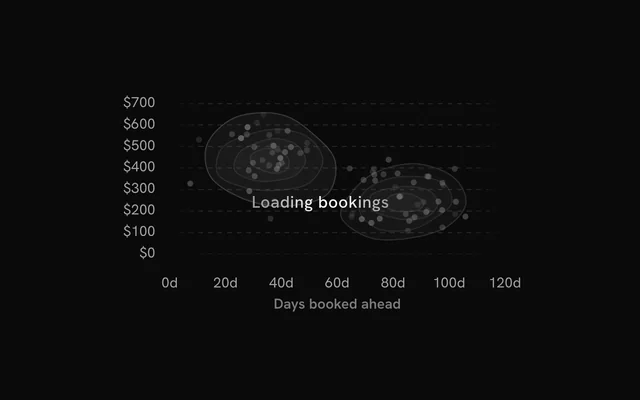
status?ChartStatus
"loading" draws a pulsing skeleton of the chart's shape in place of its marks (the axes, grid and land stay) and ignores the pointer; switching to "ready" plays the entrance.
- Default
"ready"
loadingLabel?string
Text shown centered over the chart, with a shimmer, while status is "loading". Nothing is shown when it is unset or empty.
className?string
Additional class name for the chart container.
children?ReactNode
The chart's carriers: its layers, axes, grid, tooltip and legend.
ariaLabel?string
Accessible label of the chart.
ariaDescription?string
Longer accessible description of the chart.
DensityContours
bandwidth?number
Smoothing of the estimate: the Gaussian kernel's bandwidth, in pixels. Larger is smoother.
- Default
20
thresholds?number | readonly number[]
The number of levels, or the exact density levels (observations per square pixel).
- Type
number | readonly number[]- Default
8
fillOpacity?number
Opacity of each band's fill; nested bands add up, so the densest areas read darkest.
- Default
0.14
strokeWidth?number
Width of each level's outline, in pixels (0: none).
- Default
1
strokeOpacity?number
Opacity of each level's outline.
- Default
0.55
color?string
A single color for every band; defaults to each group's color (--chart-1 without groups).
inactiveOpacity?number
Opacity of the bands while a point is hovered or focused.
- Default
0.5
fadeOnHover?boolean
Dim the layer's other marks while one is hovered or focused.
- Default
true