shadcn.io is an independent project built on shadcn/ui
Installation
Usage
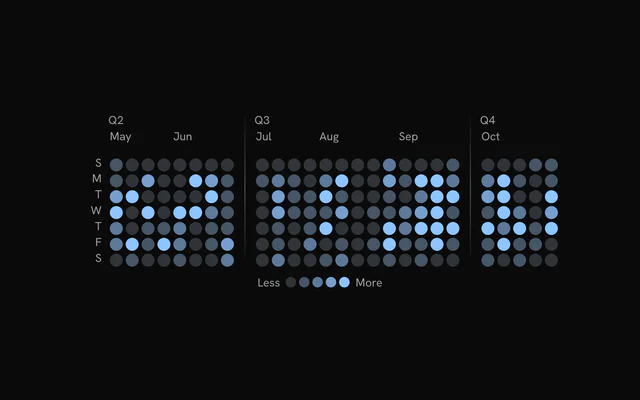
import { ChartHeatmapWeekdays } from "@/components/charts/chart-heatmap-weekdays";<ChartHeatmapWeekdays />API Reference
HeatmapChart
dataHeatmapColumn[]
Column data: one entry per week (or category) with the row bins inside.
xDomain?[Date, Date]
Visible time range. Only week columns that overlap the domain are drawn.
sizingColumnCount?number
Week columns to size the cells for while xDomain is set, so the cell size holds while scrubbing the domain (the filtered columns can vary by one at its edges).
layout?"fluid" | "fill"
"fluid": the width drives square cells and the chart height hugs the grid (GitHub style). "fill": the chart takes its parent's height and the square cells grow to the largest size that fits both the width and that height.
- Type
"fluid" | "fill"- Default
"fluid"
margin?Readonly<Partial<HeatmapMargin>>
Chart margins in pixels. Omitted sides keep their default.
- Type
Readonly<Partial<HeatmapMargin>>- Default
{ top: 28, right: 16, bottom: 0, left: 40 }
binSize?number
Fixed cell size in pixels. When 0, cells are square and sized to fit the available width.
- Default
0
gap?number
Gap between cells in pixels.
- Default
2
colorScale?(count: number | null | undefined) => string
Replaces the default level color scale. Receives a count and returns a CSS color.
- Type
(count: number | null | undefined) => string
levelColors?HeatmapLevelColors
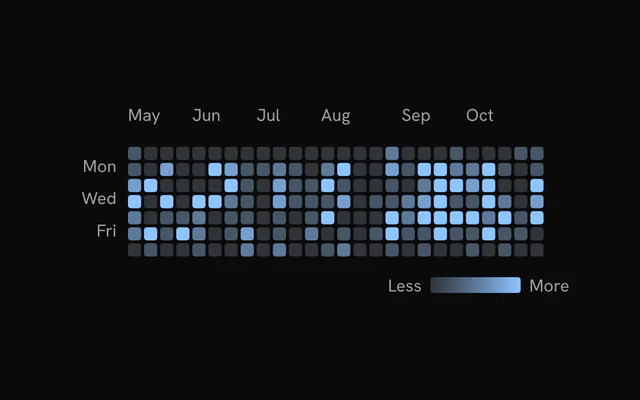
Colors for the five levels of the Less to More scale (empty plus four activity levels).
- Default
the `--chart-scale-01` to `--chart-scale-05` CSS variables
levelStyles?HeatmapLevelStyles
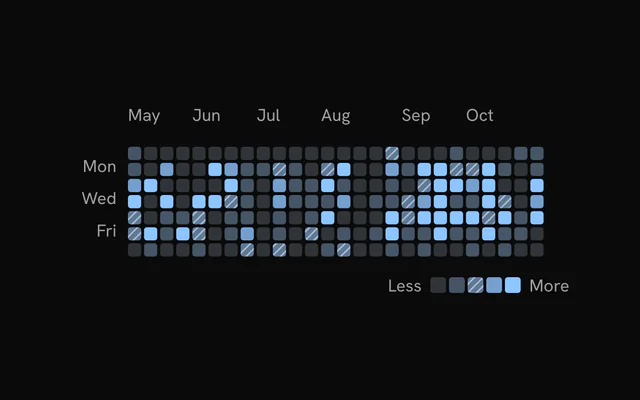
Per-level fill styles (color and optional pattern). Takes precedence over levelColors.
aspectRatio?string
CSS aspect ratio of the outer container, for example "2 / 1". Omit to fill the parent.
className?string
Additional class name for the chart container.
status?ChartStatus
Data status. "loading" draws the shimmering skeleton cells.
- Default
"ready"
loadingLabel?string
Centered label shown while status is "loading".
animationDuration?number
Enter animation duration in milliseconds: how long the column wave takes to cross the grid. 0 disables the cell entrance.
- Default
1100
enterTransition?HeatmapEnterTransition
Enter transition of the column wave, as the line chart's reveal reads it: duration (seconds) replaces animationDuration, and a "tween"'s ease (a cubic-bezier tuple or "linear") paces the wavefront. Each cell then settles in over 450 ms.
- Default
undefined (`animationDuration` on the reveal ease, cubic-bezier(0.85, 0, 0.15, 1))
revealSignature?string
Changing this string replays the enter animation.
- Default
""
enterStaggerScale?number
Scales the wave stagger between cells (1 is the default pacing).
- Default
1
animate?boolean
Plays the enter fade-in and the loading shimmer. Set to false for no motion.
- Default
true
loadingOpacity?number
Chart opacity while status is "loading".
- Default
1
showLoadingCells?boolean
Shows the shimmering skeleton cells while loading.
- Default
true
loadingCellMaxOpacity?number
Highest opacity (0 to 1) the loading cells animate toward.
- Default
0.85
loadingCellRandomness?number
Share of cells (0 to 1) that take part in the loading shimmer.
- Default
1
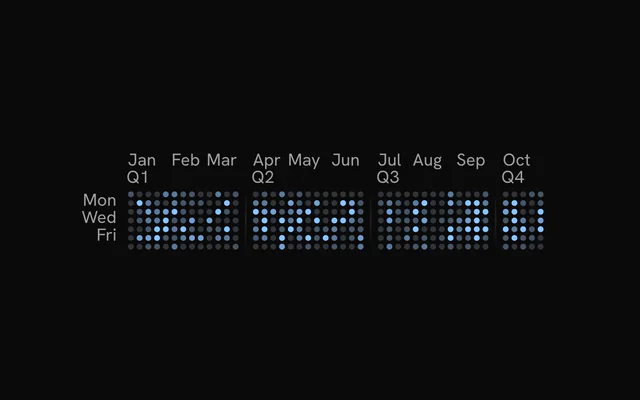
columnSeparators?HeatmapSeparatorParsedConfig
Inserts horizontal gaps between groups of columns. A HeatmapSeparator child overrides it.
weekStartDay?HeatmapWeekStartDay
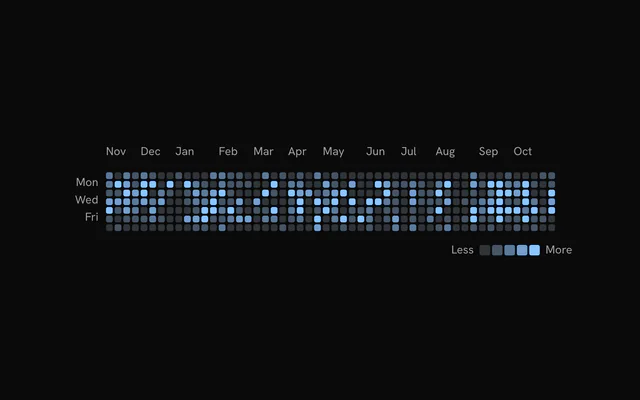
First row of the grid: 0 is Sunday (GitHub default), 1 Monday, and so on. Rotates the rows for display without reshaping your data.
- Default
0
children?ReactNode
HeatmapCells, HeatmapXAxis, HeatmapYAxis, HeatmapTooltip and HeatmapSeparator configuration children. HeatmapCells is required for the grid to draw.
ariaLabel?string
Accessible name of the chart.
- Default
"Heatmap chart"
ariaDescription?string
Accessible description of the chart. Falls back to the ariaDescription of HeatmapCells.
HeatmapCells
cornerRadius?number
Corner radius of each cell in pixels.
- Default
2
colorScale?(count: number | null | undefined) => string
Overrides the chart color scale for the cells. Receives a count and returns a CSS color.
- Type
(count: number | null | undefined) => string
inactiveOpacity?number
Opacity of the cells that are not highlighted while hovering a cell or a legend level.
- Default
0.3
inactiveScale?number
Scale of the cells that are not highlighted while hovering.
- Default
1
activeScale?number
Scale of the highlighted cell while hovering.
- Default
1
rowOpacity?number | readonly number[]
Opacity per display row (row 0 is the top row after weekStartDay rotation). A single number applies to every row; an array gives one value per row. Pass the same value to HeatmapYAxis to keep labels aligned.
- Type
number | readonly number[]- Default
1
interactive?boolean
Enables pointer hover, dimming, tooltip and keyboard focus on the cells.
- Default
true
hideGhostCells?boolean
Hides the out-of-range cells at the start and end of the grid (GitHub style).
- Default
true
ariaLabel?string
Accessible name of the chart. HeatmapChart ariaLabel takes precedence.
ariaDescription?string
Accessible description of the chart. HeatmapChart ariaDescription takes precedence.
renderer?ChartMarkRenderer
Where the cells draw: "svg", one element per cell, or canvasRenderer, one bitmap, for thousands of cells (the axes, labels, separators, hovered cell and tooltip stay SVG). On a canvas the cells reveal as one left-to-right sweep instead of cell by cell, dim together on hover (inactiveScale doesn't shrink them), skip the fade back to loading, and can't take pattern fills.
- Default
"svg"
HeatmapXAxis
className?string
Additional class name for the month labels, for example "text-foreground" (a color class sets the label color).
HeatmapYAxis
className?string
Additional class name for the weekday labels, for example "text-foreground" (a color class sets the label color).
tickFilter?HeatmapYAxisTickFilter
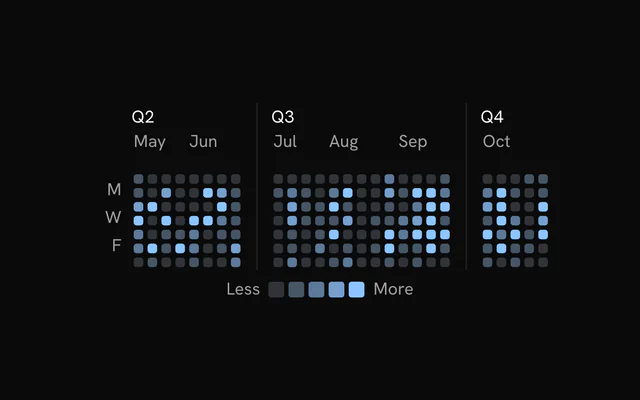
Which rows get a weekday label: every row, odd rows (Mon, Wed, Fri with a Sunday start) or even rows.
- Default
"odd"
labelFormat?HeatmapYAxisLabelFormat
"full" shows the abbreviated weekday (Mon); "initial" shows its first letter (M).
- Default
"full"
rowOpacity?number | readonly number[]
Opacity per display row for the labels. Pass the same value as HeatmapCells so faded rows and their labels stay aligned.
- Type
number | readonly number[]
HeatmapTooltip
formatLabel?(count: number, date: Readonly<Date>) => string
Custom text for the contribution line of the tooltip. Receives the count and the cell date.
- Type
(count: number, date: Readonly<Date>) => string- Default
`N contribution(s)`
className?string
Additional class name for the tooltip panel.
panelStyle?Readonly<CSSProperties>
Inline styles for the tooltip panel.
- Type
Readonly<CSSProperties>
backgroundColor?string
Background of the tooltip panel (a CSS color or variable).
instant?boolean
Shows and hides the tooltip without enter or exit motion; the hide is still held for hideDelay.
- Default
false
showDelay?number
Delay in milliseconds before the tooltip first appears. Moving between cells updates it immediately.
- Default
0
hideDelay?number
Hold in milliseconds after the pointer leaves a cell before the tooltip hides. Reduces flicker between adjacent cells. The hold lasts at least as long as the follow spring takes to settle.
- Default
120
damping?number
Damping of the spring the panel follows the hovered cell with, on the same scale as ChartTooltip's. 0 snaps between cells.
- Default
20
springConfig?SpringConfig
An explicit follow spring (stiffness, damping) for the panel; takes precedence over damping.