Heatmap Examples
11 heatmaps: a year of contributions, quarter dividers, faded weekends, patterned levels, dots and a year that scrolls sideways. Each on React, Vue, Svelte and Solid, drawn with TanStack Charts in your theme. Heatmap docs and API.
Every heatmap example
11 examples.
- Contribution HeatmapHeatmapA year of daily contributions in week columns, with month and weekday labels and a legend.
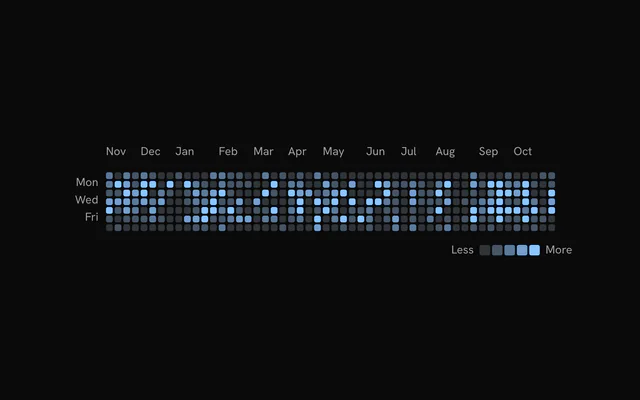
- Heatmap with a Striped LevelHeatmapThe middle level filled with diagonal stripes, and the legend's swatch striped to match.
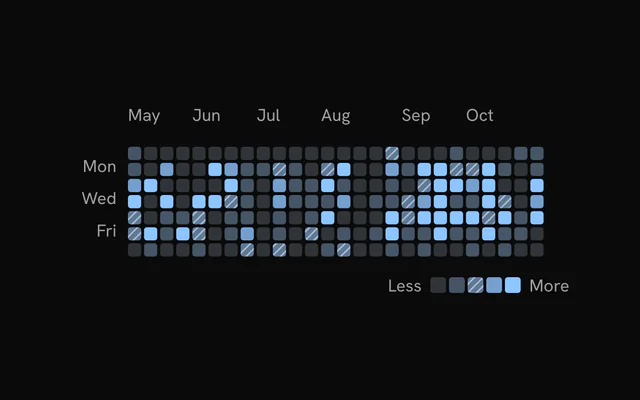
- Heatmap with Faded WeekendsHeatmapThe grid starts on Monday, and the weekend rows fade back along with their labels.
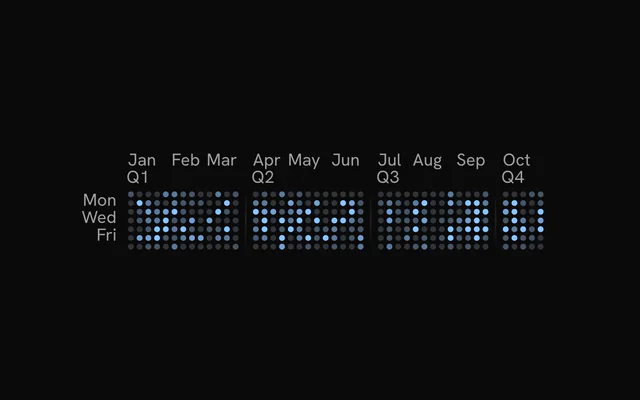
- Heatmap Split by QuarterHeatmapJanuary to October, each calendar quarter opened by a gap, a fading line and its label.
- Heatmap with a Gradient LegendHeatmapOne continuous bar from empty days to the busiest stands in for the five swatches.
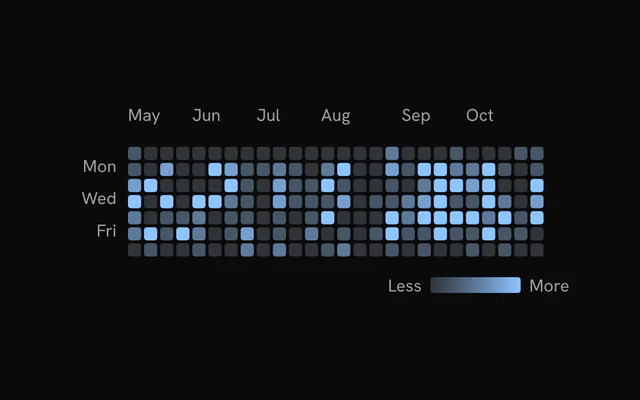
- Dot HeatmapHeatmapRound cells with quarter dividers, and hovering a day shrinks and dims the others slightly.
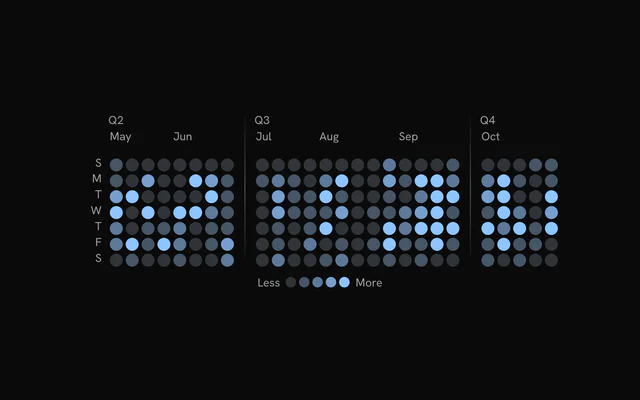
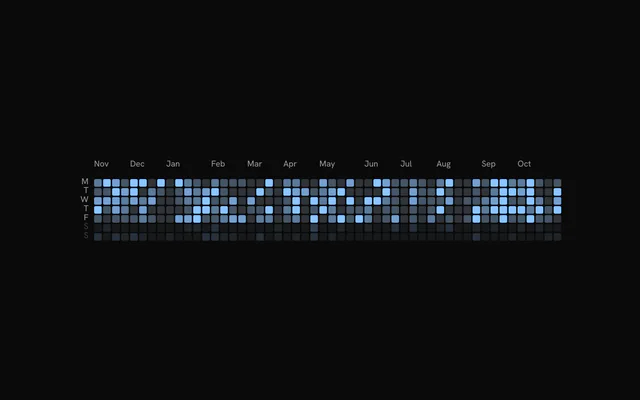
- Heatmap with Solid DividersHeatmapPlain lines between quarters, labels above the grid, and one-letter weekday names.
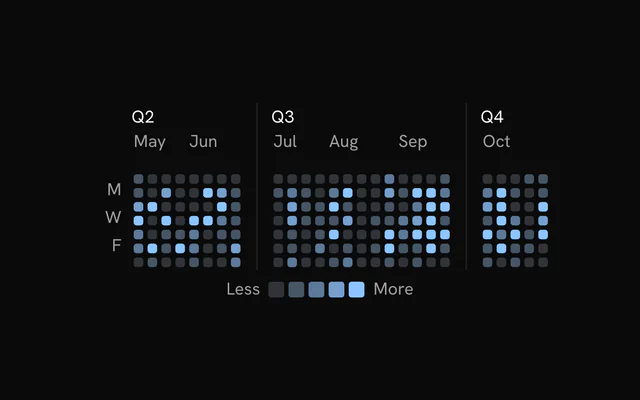
- Heatmap with Dashed DividersHeatmapDashed quarter lines that fade at both ends, and no weekday labels at all.
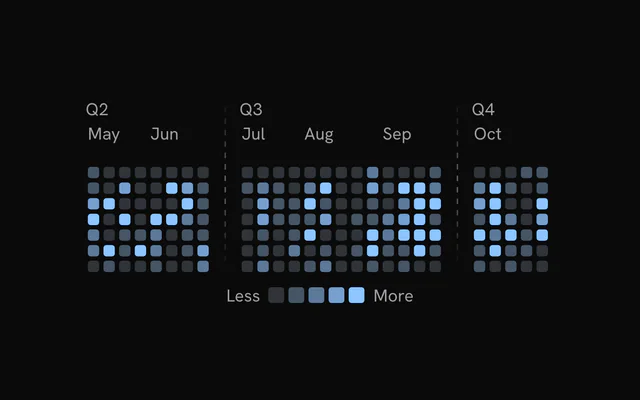
- Heatmap That Lifts on HoverHeatmapThe hovered day grows to 110% while the rest fade, and the legend's swatches do the same.
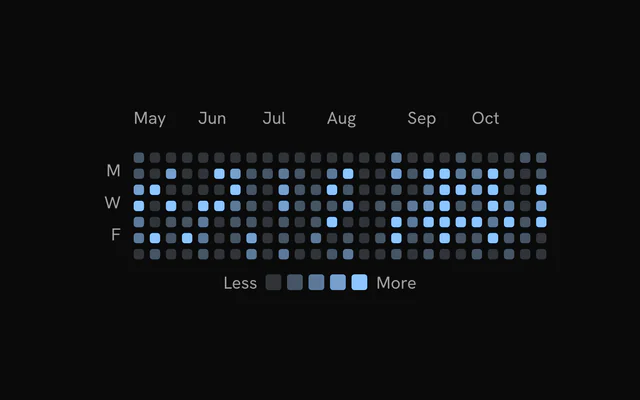
- Scrolling HeatmapHeatmapFixed 20 px cells that scroll sideways in a narrow card while the weekday labels stay put.
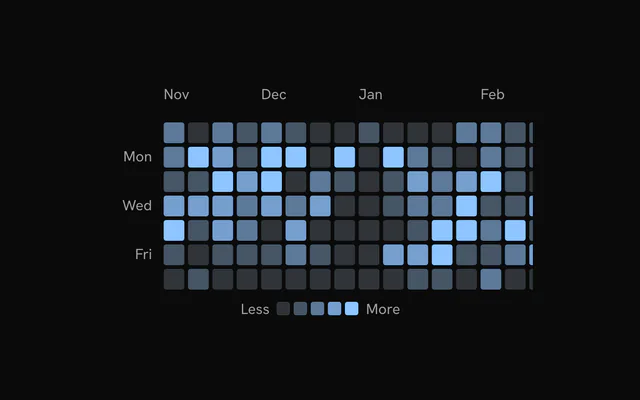
- Heatmap Loading StateHeatmapShimmering skeleton cells until you switch loading off, then the real cells play in as a wave.

Or describe it. With Pro, your AI agent installs the heatmap example you describe, on your framework.
Get ProGalleries
More chart examples
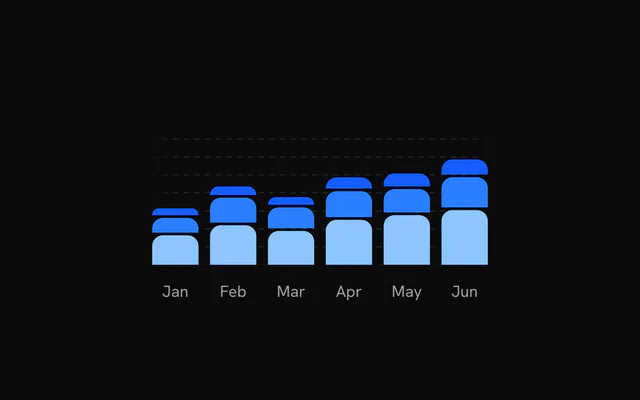
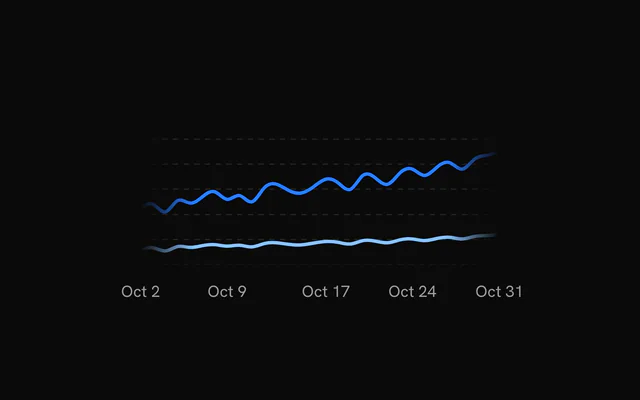
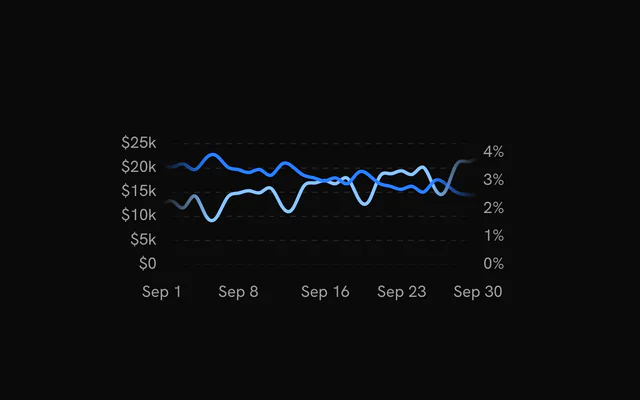
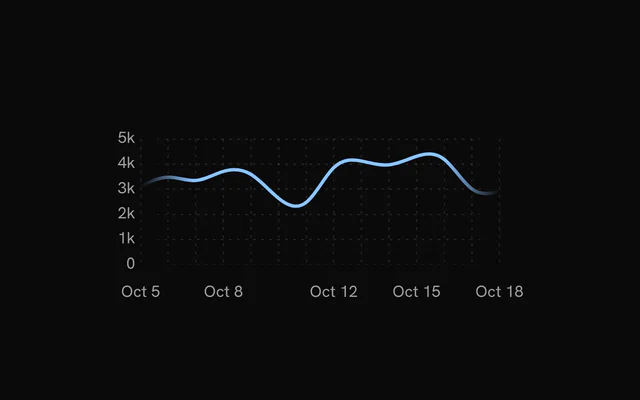
8 more chart types, free: open one for its examples and their code.
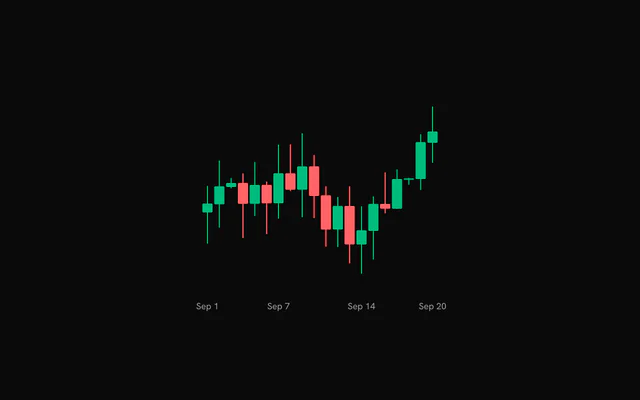
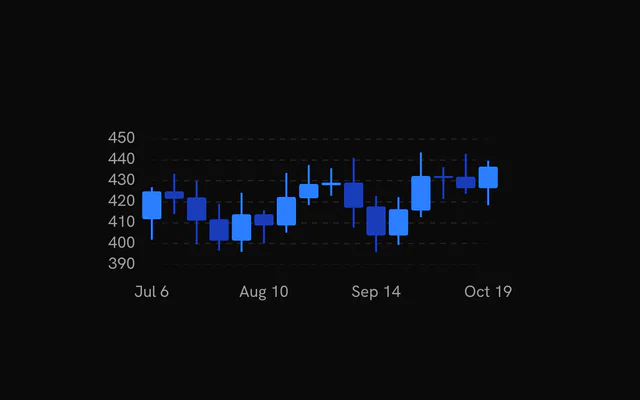
Pricing
Heatmap examples MCP, with Pro
Your AI agent installs any of the 1434 examples, and every component, block and icon, with every Pro plan.
4.9/5 out of 5 · 150+ reviewsfrom 150+ founders and developers.
- Secure checkout via Stripe
- Code lives in your repo
- Keep what you've shipped if you cancel
- License terms
FAQ
Frequently asked questions
11: Contribution Heatmap, Heatmap with a Striped Level, Heatmap with Faded Weekends, Heatmap Split by Quarter, Heatmap with a Gradient Legend, Dot Heatmap, Heatmap with Solid Dividers, Heatmap with Dashed Dividers, Heatmap That Lifts on Hover, Scrolling Heatmap and Heatmap Loading State. Each page has the live chart, its code and a one-line install.
Signed in, copy the chart's command: `npx shadcn@latest add` with its URL. It adds the chart to `components/charts`, the `chart-kit` kit every chart imports, and `@tanstack/charts`. Import the chart and render it.
Yes. Every chart is free to use in personal and commercial projects. Seeing the code and installing it takes a free account, one tap with Google or GitHub. Pro is the site's paid plan for blocks, the Pro collections and the MCP, and the charts don't need it.
4.9 out of 5 from 150+ developers


Every heatmap example. One prompt away.
Every heatmap example is free with an account. With Pro, your AI agent installs them from a prompt.
Get Pro