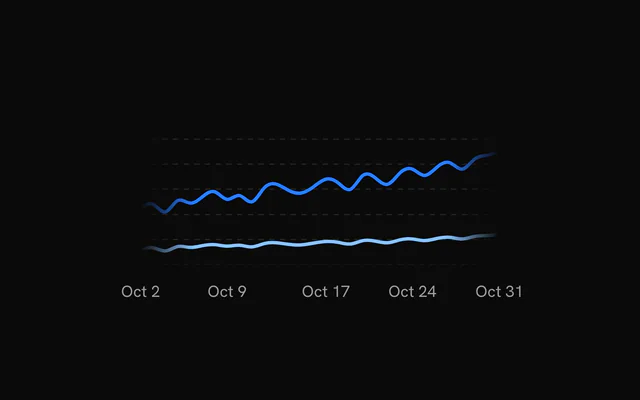
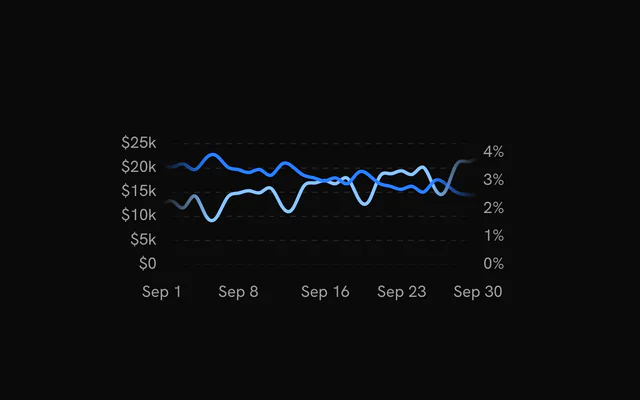
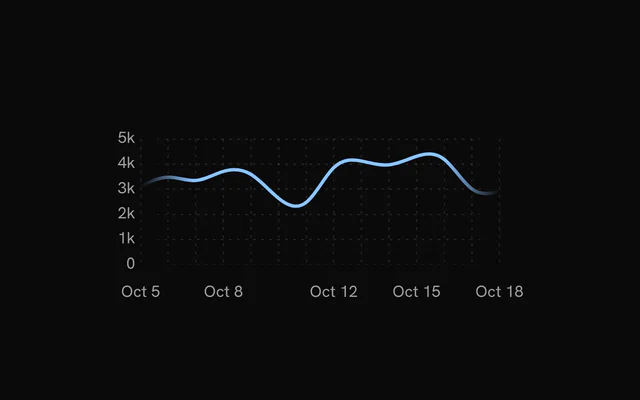
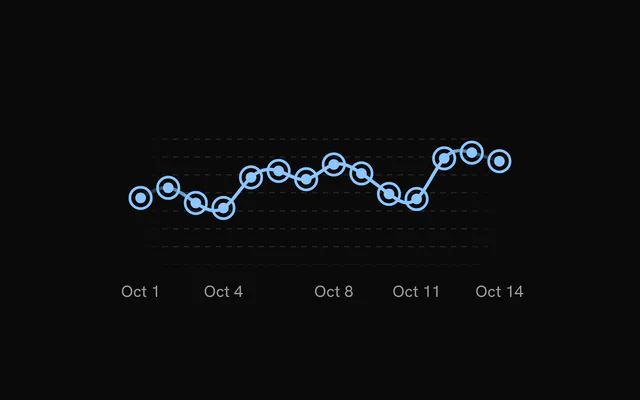
shadcn.io is an independent project built on shadcn/ui
Installation
Usage
import { ChartLineGlow } from "@/components/charts/chart-line-glow";<ChartLineGlow />API Reference
LineChart
dataChartDatum[]
The rows to plot. Each row is an object holding the x value under xDataKey and one number per series under that series' dataKey.
xDataKey?string
Key of the x value in each row. The value must be a Date (or something new Date() accepts, such as a timestamp).
- Default
"date"
status?ChartStatus
"loading" shows the loading state (skeleton line, grid shimmer, optional label) and ignores the pointer; switching to "ready" reveals the real data on the same chart instance.
- Default
"ready"
animationDuration?number
Duration of the entrance reveal in milliseconds. 0 skips the animation.
- Default
1100
margin?Partial<ChartMargin>
Space around the plot area in pixels, for axis labels and the tooltip. Missing sides use the default.
- Type
Partial<ChartMargin>- Default
{ top: 40, right: 40, bottom: 40, left: 40 }
aspectRatio?string
CSS aspect ratio of the chart ("width / height" or a number), applied to the container width.
- Default
"2 / 1"
className?string
Extra CSS class name for the chart container.
onPhaseChange?(phase: ChartPhase) => void
Called with "loading" or "ready" when status changes (and once on mount).
- Type
(phase: ChartPhase) => void
childrenReactNode
The layers to draw: Grid, Line, XAxis, YAxis, ChartTooltip and the other chart children.
loadingLabel?string
Text shown centered over the chart, with a shimmer, while status is "loading". Nothing is shown when it is unset or empty.
style?CSSProperties
Inline styles for the chart container, for example a fixed height for a brush strip.
animationEasing?string
CSS easing of the entrance reveal (a cubic-bezier(…), linear, ease-in-out…). enterTransition takes priority.
- Default
"cubic-bezier(0.85, 0, 0.15, 1)"
yDomainTween?boolean
Animate the y domain when the data or status changes instead of jumping to the new scale.
- Default
true
yDomains?Readonly<Record<string, YDomainOverride>>
Per-axis y-domain overrides, keyed by yAxisId ("left" for the default axis): a fixed [min, max], or a function of the auto domain (before it is niced) that returns the one to use, e.g. { left: ([, max]) => [0, max * 3] }. Hoist the object out of render.
- Type
Readonly<Record<string, YDomainOverride>>
yDomainTweenDuration?number
Duration in milliseconds of the y-domain tween (a data update, the loading to ready handoff, a brushed window).
- Default
500
xDomain?[Date, Date]
Visible x range as [start, end], used for brush zoom. The chart plots only this range of data.
xDomainSlotCount?number
Length of the full dataset while xDomain zooms into part of it. It keeps the x spacing consistent with the unzoomed chart.
tweenYDomainOnXDomainChange?boolean
Accepted for bklit-ui compatibility. It has no effect.
enterTransition?EnterTransition
The entrance reveal as a motion transition: its duration (seconds) and ease (a cubic-bezier array or a CSS easing) override animationDuration and animationEasing. A reveal is always a tween.
yScaleDomainMax?number
Fixed top of the y domain on a single-axis chart: the domain becomes [0, yScaleDomainMax × 1.1] (niced) instead of following the data, leaving headroom above the series or keeping several charts on one scale.
revealSignature?string
Changing this string replays the entrance animation. Do not change it when only the data changes.
ariaLabel?string
Accessible name of the chart.
- Default
"Line chart"
ariaDescription?string
Longer accessible description of the chart, exposed as aria-description.
syncId?string
Charts with the same syncId move together: hovering or keyboard-focusing one shows the crosshair, dots and date pill at the same date on the others (the same category, for bar charts), and a ChartBrush or ChartZoom in a time chart zooms the time charts of the group to its window.
syncY?boolean
With syncId: every chart of the group draws on one y scale (the union of their data), so small multiples compare at a glance. Read by LineChart and AreaChart.
- Default
false
activeIndex?number | null
Index into data of the row to focus (crosshair, dots and tooltip), for example the row a table has under the pointer. null clears it.
- Type
number | null
onActiveIndexChange?(index: number | null) => void
Called with the index into data of the row the pointer or keyboard focuses, and with null when the focus leaves.
- Type
(index: number | null) => void
LineBackdrop
dataKeystring
The series it follows: the dataKey of the Line it sits behind.
yAxisId?string | number
Id of the y scale the series is plotted against.
- Type
string | number- Default
"left"
side?"above" | "below"
The region it fills: between the line and the top of the plot ("above") or between the line and the bottom ("below").
- Type
"above" | "below"- Default
"above"
curve?CurveFactory
d3-shape curve factory: keep it the line's.
- Default
curveNatural
animate?boolean
Fade in after the line's reveal and follow its data and y-domain tweens. false shows it at once.
- Default
true
stops?readonly LineBackdropStop[]
Radial gradient stops, centre to rim. Defaults to var(--chart-line-primary) at 35% opacity fading to transparent.
center?{ readonly x: number; readonly y: number }
Centre of the gradient as fractions of the plot's width and height.
- Type
{ readonly x: number; readonly y: number }- Default
{ x: 0.5, y: 1 }
radius?{ readonly x: number; readonly y: number }
Radii of the gradient as fractions of the plot's width and height.
- Type
{ readonly x: number; readonly y: number }- Default
{ x: 0.75, y: 1 }
opacity?number
Overall opacity of the backdrop, 0-1.
- Default
1
Line
dataKeystring
Key of the data field that holds this line's y values.
label?string
Name of the series in the default tooltip row and the chart context's \lines\ (what a legend built from them reads). Defaults to \dataKey\.
stroke?string
Stroke color of the line.
- Default
"var(--chart-line-primary)"
strokeWidth?number
Stroke width of the line in px.
- Default
2.5
curve?CurveFactory
d3-shape curve factory used to interpolate between points.
- Default
curveNatural
yAxisId?string | number
Id of the y scale this line is plotted against. Use it with a matching YAxis to give a series its own scale.
- Type
string | number- Default
"left"
fadeEdges?FadeEdges
Fade the line toward transparent at the chart edges. true fades both ends, "left" or "right" fades one side, false turns the fade off, and { left, right } sets each side's fade zone as a percentage of the plot width (0-50).
- Default
true
strokeGradient?StrokeGradient
A colour ramp across the plot, left to right: plain colours are spaced evenly, { offset, color } stops (offset 0-1) place them. It composes with fadeEdges and replaces stroke for the line's paint (stroke still colours the markers and the tooltip dot).
glow?boolean | Readonly<LineGlow>
A soft outer glow: a blurred copy of the stroke behind the line. true uses the defaults; { blur, opacity, strokeWidth } tunes it.
- Type
boolean | Readonly<LineGlow>- Default
false
showHighlight?boolean
Draw a highlighted segment of the line around the hovered point.
- Default
true
highlight?Readonly<LineHighlight>
The hover highlight's styling: colour or ramp, width, soft ends (fadeLength), glow, span and how far the rest of the line dims (dimOpacity). See LineHighlight.
- Type
Readonly<LineHighlight>
showMarkers?boolean
Draw a circle marker at every data point.
- Default
false
markers?Readonly<SeriesPointMarkerStyle>
Styling of the point markers drawn by showMarkers. See SeriesPointMarkerStyle.
- Type
Readonly<SeriesPointMarkerStyle>
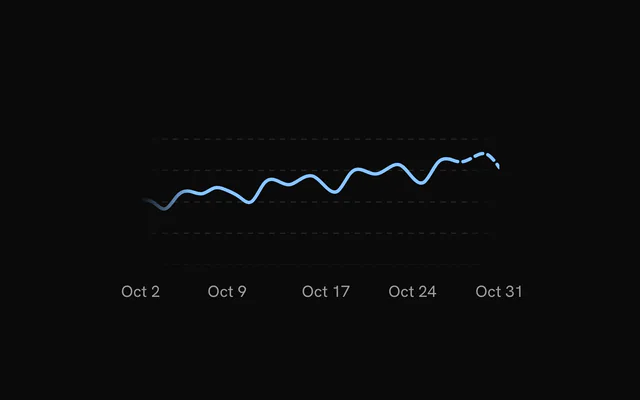
dashFromIndex?number
Data index from which the line is drawn dashed (inclusive). Useful for marking an incomplete or projected period.
dashArray?string
Dash pattern of the dashed tail when dashFromIndex is set.
- Default
"6,4"
loadingStroke?string
Stroke color of the loading pulse overlay.
- Default
"var(--chart-foreground)"
loadingStrokeOpacity?number
Stroke opacity of the loading pulse overlay.
- Default
0.5
animate?boolean
Whether the point markers animate in. The line itself always enters with the chart's animationDuration.
- Default
true
loading?boolean
Show the loading pulse overlay on this line. When unset, the pulse follows the chart's status. Set false to disable it even while the chart is loading.
loadingPulseMode?LineLoadingPulseMode
Phase of the loading pulse: "loop" repeats, "exit" plays the loading to ready transition, "enter" plays ready to loading.
- Default
"loop"
loadingStyle?LoadingStyle
Loading animation: a travelling "pulse" or a diagonal "sweep" shimmer across the skeleton line.
- Default
"pulse"
onLoadingPulseCycleComplete?() => void
Called each time a "loop" pulse cycle completes.
- Type
() => void
renderer?ChartMarkRenderer
Where the line draws: "svg", a path, or canvasRenderer, a bitmap the chart's canvas lines share, for tens of thousands of points (the grid, axes, hover highlight, markers, glow, crosshair and tooltip stay SVG). On a canvas the line dims with the others on hover (a legend can't dim it alone) and doesn't take a fadeEdges mask.
- Default
"svg"
ChartTooltip
showDatePill?boolean
Show the date pill that rides along the bottom of the plot.
- Default
true
showCrosshair?boolean
Show the vertical crosshair line. Bar charts leave it off unless this is true (the dots and the category pill mark the bar).
- Default
true
showDots?boolean
Show a dot on every series at the hovered position.
- Default
true
dotVariant?"dot" | "ring"
Dot style: a filled "dot" or a transparent "ring" square. Read by BarChart only.
- Type
"dot" | "ring"- Default
"dot"
dotSize?number
Dot radius in px.
- Default
5
dotRadiusFraction?number
Corner radius of the "ring" variant as a fraction of its side (0 is square, 0.5 is a circle). Read by BarChart only.
- Default
0.25
dotScale?number
Multiplier applied to the dot or ring size. Read by BarChart and LiveLineChart.
- Default
1
dotStrokeWidth?number
Stroke width of the dots in px.
- Default
2
indicatorColor?string | ((point: Record<string, unknown>) => string)
Color of the crosshair. Only a string is applied; the function form that bklit-ui accepts is ignored and the default is used.
- Type
string | ((point: Record<string, unknown>) => string)- Default
"var(--chart-crosshair)"
content?(props: { point: Record<string, unknown>; index: number; pinned?: boolean; dismiss?: () => void }) => ReactNode
Replaces the default tooltip panel body. Receives the hovered data row and its index; with pinnable, also whether the panel is pinned and a dismiss that unpins it (for a close button in a pinned panel's detail).
- Type
(props: { point: Record<string, unknown>; index: number; pinned?: boolean; dismiss?: () => void }) => ReactNode
pinnable?boolean
A click (or Enter, or Space) on the chart pins the tooltip where it is: the panel takes the pointer, so its content can grow into detail and hold controls, until another click, Escape or dismiss lets it go.
- Default
false
rows?(point: Record<string, unknown>) => { readonly color: string; readonly label: string; readonly value: string | number }[]
Replaces the default rows (one per series) with your own list of { color, label, value }.
- Type
(point: Record<string, unknown>) => { readonly color: string; readonly label: string; readonly value: string | number }[]
dotColor?string | ((point: Record<string, unknown>, line: ChartLineConfig) => string)
Fill of the tooltip dots. A function receives the hovered row and the series config, and is called again each time the hovered row changes. Defaults to each series' color; a ProfitLossLine's dot takes the color of the hovered value's sign.
- Type
string | ((point: Record<string, unknown>, line: ChartLineConfig) => string)
children?ReactNode
Extra content rendered below the rows in the default panel, for example marker details. Without it, a chart with ChartMarkers lists the markers on the hovered date there.
className?string
Extra class name for the tooltip panel.
springConfig?SpringConfig
Spring for the floating panel when matchCrosshair is on. Defaults to the chart's tooltip spring.
matchCrosshair?boolean
Make the floating panel follow the pointer with the same spring as the crosshair instead of damping.
- Default
false
damping?number
Spring damping for the floating panel when matchCrosshair is off, on bklit's 0 to 100 scale: lower is bouncier, higher slower, 0 moves the panel instantly. The default, 20, is the snappy hover spring (stiffness 3600, damping 120); every other value is bklit's spring for it played six times faster.
- Default
20
indicatorDasharray?string
Dash pattern of the crosshair. Omit for a solid line.
indicatorFadeEdges?IndicatorFadeEdges
Vertical fade of the crosshair: both ends, the top, the bottom, or none (solid).
- Default
"both"
indicatorFadeLength?number
Size of the crosshair's fade, as a percentage of its height (2 to 40).
- Default
10
indicatorEndColor?string
Bottom colour of the crosshair: it ramps from indicatorColor at the top to this at the bottom (composes with the fade).
indicatorEnd?"plot" | "point"
How far down the crosshair reaches: the whole plot, or down to the hovered point of the first series.
- Type
"plot" | "point"- Default
"plot"
dotHaloBlur?number
Blur in px on the dots' halo, for a soft glow.
- Default
0
topOffset?number
Extra gap in px between the top of the plot and the tooltip panel.
- Default
0
dateLabels?readonly string[]
The date pill's text for each data row, in row order (pair it with XAxis labels).
boxSpringConfig?SpringConfig
Spring for the floating panel. Takes priority over matchCrosshair and damping.
panelStyle?CSSProperties
Accepted for bklit-ui compatibility. It has no effect in bklit-tanstack-charts. Style the panel with className or the --chart-tooltip-* CSS variables instead.
backgroundColor?string
Accepted for bklit-ui compatibility. It has no effect in bklit-tanstack-charts. Set --chart-tooltip-background instead.
indicatorWidth?IndicatorWidth
Thickness of the crosshair: a width in px, or "line" (1px), "thin" (2px), "medium" (4px) or "thick" (8px).
- Default
"line"
columnWidth?number
Accepted for bklit-ui compatibility. It has no effect in bklit-tanstack-charts.