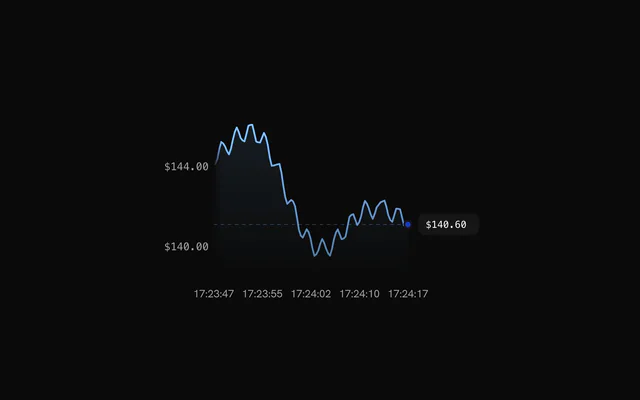
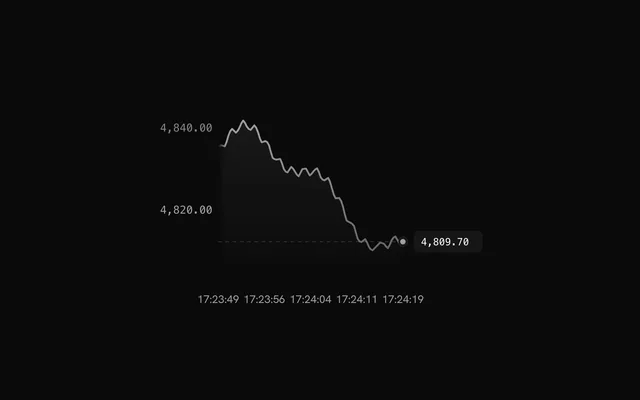
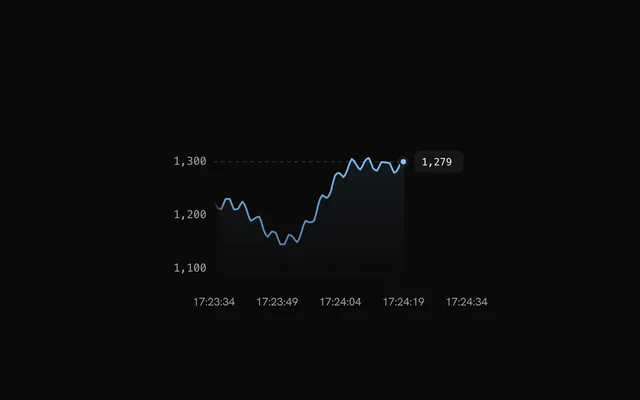
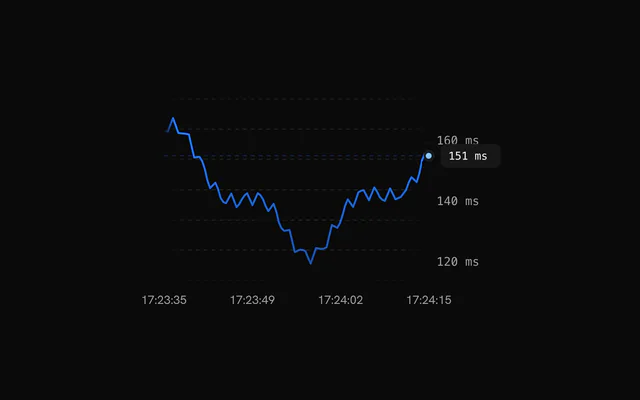
shadcn.io is an independent project built on shadcn/ui
Installation
Usage
import { ChartLiveLinePatternBand } from "@/components/charts/chart-live-line-pattern-band";<ChartLiveLinePatternBand />API Reference
LiveLineChart
dataLiveLinePoint[]
The streaming samples, oldest first. Append new points as they arrive.
valuenumber
The latest value. The chart eases its display toward it.
dataKey?string
Key used for the value field.
- Default
"value"
window?number
Visible time window in seconds.
- Default
30
numXTicks?number
Number of x axis labels; also sizes the leading offset.
- Default
5
nowOffsetUnits?number
Leading offset in x tick units. 0 puts "now" at the right edge.
- Default
0
exaggerate?boolean
Use a tight y range around the data instead of the default padded one.
- Default
false
lerpSpeed?number
How fast the displayed value and y range ease toward their targets (0 to 1).
- Default
0.08
margin?Partial<ChartMargin>
Space around the plot area in pixels. Missing sides use the default.
- Type
Partial<ChartMargin>- Default
{ top: 24, right: 16, bottom: 32, left: 16 }
paused?boolean
Freeze the scrolling.
- Default
false
childrenReactNode
The layers to draw: LiveLine, Grid (its horizontal rows; vertical columns are not drawn), LiveXAxis, LiveYAxis, ChartTooltip.
className?string
Extra CSS class name for the chart container.
style?CSSProperties
Inline styles for the chart container. Set height to size the chart.
ariaLabel?string
Accessible name of the chart.
- Default
"Live line chart"
ariaDescription?string
Longer accessible description of the chart, exposed as aria-description.
ReferenceArea
y1?number
Lower y data bound. The band extends to the plot top when omitted.
y2?number
Upper y data bound. The band extends to the plot bottom when omitted.
x1?Readonly<Date> | number
Starting x data coordinate. The band extends to the plot left when omitted.
- Type
Readonly<Date> | number
x2?Readonly<Date> | number
Ending x data coordinate. The band extends to the plot right when omitted.
- Type
Readonly<Date> | number
yAxisId?string | number
Id of the y-scale group the y bounds refer to.
- Type
string | number- Default
"left"
fill?string
Fill color of the band.
- Default
`color-mix(in oklch, var(--chart-foreground-muted) 12%, transparent)`
fillOpacity?number
Opacity of the fill.
- Default
1
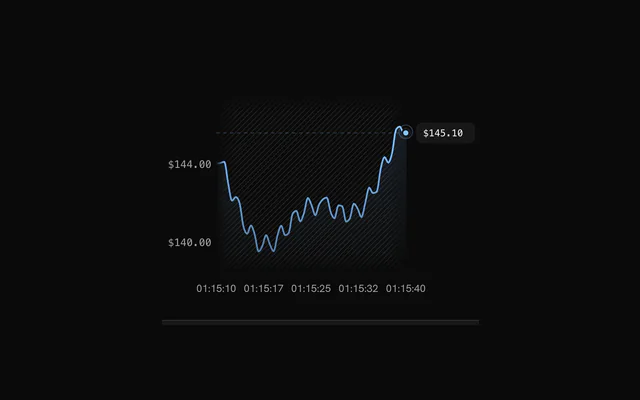
pattern?PatternPresetId
Pattern that fills the band instead of the solid fill: "diagonal", "horizontal", "vertical", "cross", "dots", "circles", and the other presets.
- Default
"none"
patternColor?string
Color of the pattern lines or dots.
- Default
"var(--chart-foreground-muted)"
patternScale?number
Scales the pattern tile. 2 doubles it.
- Default
1
patternStrokeWidth?number
Stroke width of the pattern lines, or of the ring around circles.
patternRadius?number
Radius of the pattern dots or circles in px.
patternComplement?boolean
Also draw circles at the tile corners so the pattern reads as a staggered grid.
patternFill?string
Fill color of the pattern dots or circles.
patternDotFill?boolean
Fill the pattern dots (false draws rings).
patternTileBackground?string
Background color painted under each pattern tile.
stroke?string
Color of the band's top and bottom edge lines.
- Default
"var(--chart-foreground-muted)"
strokeWidth?number
Edge line width in px.
- Default
1
strokeStyle?ReferenceAreaStrokeStyle
"dashed" or "solid" edge lines.
- Default
"dashed"
strokeDasharray?string
Dash pattern of the edge lines when strokeStyle is "dashed".
- Default
"4,4"
fadeEdges?boolean
Fade the fill and edge lines out over the outer 10% of the band at the left and right.
- Default
true
fadeEdgesLength?number
Accepted so bklit-ui code compiles. Not applied by this package. The fade zone is fixed at 10%.
axisLabelColor?string
Accepted so bklit-ui code compiles. Not applied by this package.
showMarkers?boolean
Draw inward triangle markers at the horizontal center of the band's top and bottom edges.
- Default
false
markerColor?string
Color of the center markers.
- Default
"var(--chart-1)"
markerSize?number
Size of the center markers in px.
- Default
6
ifOverflow?ReferenceAreaIfOverflow
Accepted so bklit-ui code compiles. Not applied by this package. The band is always clipped to the plot.
className?string
Accepted so bklit-ui code compiles. Not applied by this package.
LiveLine
dataKeystring
Key of the data field that holds the y values.
label?string
Series name in the default tooltip row, for example "Price". Defaults to the dataKey, as in bklit-ui.
stroke?string
Stroke color of the line.
- Default
"var(--chart-line-primary)"
strokeWidth?number
Stroke width of the line in px.
- Default
2
curve?CurveFactory
Accepted for bklit-ui compatibility and ignored: the line is always bklit's default curveMonotoneX. Native rolling refuses a custom curve path (custom-path, dist/motion-path.js:16), so the curve is sampled into rows (smoothRows in definition.ts) and another factory cannot be swapped in.
fill?boolean
Show the gradient fill under the line.
- Default
true
pulse?boolean
Show the pulsing live dot at the right edge.
- Default
true
dotSize?number
Radius of the live dot in px.
- Default
4
badge?boolean
Show the value badge at the live tip.
- Default
true
formatValue?(value: number) => string
Formats a value for the badge, the tooltip and the y axis labels. Defaults to two decimals.
- Type
(value: number) => string
momentumColors?MomentumColors
Colors the line, fill and dot by momentum direction. Overrides stroke for the line.
ChartTooltip
showDatePill?boolean
Show the date pill that rides along the bottom of the plot.
- Default
true
showCrosshair?boolean
Show the vertical crosshair line. Bar charts leave it off unless this is true (the dots and the category pill mark the bar).
- Default
true
showDots?boolean
Show a dot on every series at the hovered position.
- Default
true
dotVariant?"dot" | "ring"
Dot style: a filled "dot" or a transparent "ring" square. Read by BarChart only.
- Type
"dot" | "ring"- Default
"dot"
dotSize?number
Dot radius in px.
- Default
5
dotRadiusFraction?number
Corner radius of the "ring" variant as a fraction of its side (0 is square, 0.5 is a circle). Read by BarChart only.
- Default
0.25
dotScale?number
Multiplier applied to the dot or ring size. Read by BarChart and LiveLineChart.
- Default
1
dotStrokeWidth?number
Stroke width of the dots in px.
- Default
2
indicatorColor?string | ((point: Record<string, unknown>) => string)
Color of the crosshair. Only a string is applied; the function form that bklit-ui accepts is ignored and the default is used.
- Type
string | ((point: Record<string, unknown>) => string)- Default
"var(--chart-crosshair)"
content?(props: { point: Record<string, unknown>; index: number; pinned?: boolean; dismiss?: () => void }) => ReactNode
Replaces the default tooltip panel body. Receives the hovered data row and its index; with pinnable, also whether the panel is pinned and a dismiss that unpins it (for a close button in a pinned panel's detail).
- Type
(props: { point: Record<string, unknown>; index: number; pinned?: boolean; dismiss?: () => void }) => ReactNode
pinnable?boolean
A click (or Enter, or Space) on the chart pins the tooltip where it is: the panel takes the pointer, so its content can grow into detail and hold controls, until another click, Escape or dismiss lets it go.
- Default
false
rows?(point: Record<string, unknown>) => { readonly color: string; readonly label: string; readonly value: string | number }[]
Replaces the default rows (one per series) with your own list of { color, label, value }.
- Type
(point: Record<string, unknown>) => { readonly color: string; readonly label: string; readonly value: string | number }[]
dotColor?string | ((point: Record<string, unknown>, line: ChartLineConfig) => string)
Fill of the tooltip dots. A function receives the hovered row and the series config, and is called again each time the hovered row changes. Defaults to each series' color; a ProfitLossLine's dot takes the color of the hovered value's sign.
- Type
string | ((point: Record<string, unknown>, line: ChartLineConfig) => string)
children?ReactNode
Extra content rendered below the rows in the default panel, for example marker details. Without it, a chart with ChartMarkers lists the markers on the hovered date there.
className?string
Extra class name for the tooltip panel.
springConfig?SpringConfig
Spring for the floating panel when matchCrosshair is on. Defaults to the chart's tooltip spring.
matchCrosshair?boolean
Make the floating panel follow the pointer with the same spring as the crosshair instead of damping.
- Default
false
damping?number
Spring damping for the floating panel when matchCrosshair is off, on bklit's 0 to 100 scale: lower is bouncier, higher slower, 0 moves the panel instantly. The default, 20, is the snappy hover spring (stiffness 3600, damping 120); every other value is bklit's spring for it played six times faster.
- Default
20
indicatorDasharray?string
Dash pattern of the crosshair. Omit for a solid line.
indicatorFadeEdges?IndicatorFadeEdges
Vertical fade of the crosshair: both ends, the top, the bottom, or none (solid).
- Default
"both"
indicatorFadeLength?number
Size of the crosshair's fade, as a percentage of its height (2 to 40).
- Default
10
indicatorEndColor?string
Bottom colour of the crosshair: it ramps from indicatorColor at the top to this at the bottom (composes with the fade).
indicatorEnd?"plot" | "point"
How far down the crosshair reaches: the whole plot, or down to the hovered point of the first series.
- Type
"plot" | "point"- Default
"plot"
dotHaloBlur?number
Blur in px on the dots' halo, for a soft glow.
- Default
0
topOffset?number
Extra gap in px between the top of the plot and the tooltip panel.
- Default
0
dateLabels?readonly string[]
The date pill's text for each data row, in row order (pair it with XAxis labels).
boxSpringConfig?SpringConfig
Spring for the floating panel. Takes priority over matchCrosshair and damping.
panelStyle?CSSProperties
Accepted for bklit-ui compatibility. It has no effect in bklit-tanstack-charts. Style the panel with className or the --chart-tooltip-* CSS variables instead.
backgroundColor?string
Accepted for bklit-ui compatibility. It has no effect in bklit-tanstack-charts. Set --chart-tooltip-background instead.
indicatorWidth?IndicatorWidth
Thickness of the crosshair: a width in px, or "line" (1px), "thin" (2px), "medium" (4px) or "thick" (8px).
- Default
"line"
columnWidth?number
Accepted for bklit-ui compatibility. It has no effect in bklit-tanstack-charts.
LiveXAxis
numTicks?number
Number of time labels. Defaults to the chart's numXTicks.
formatTime?(time: number) => string
Formats a time (in milliseconds since the epoch) into its label. Defaults to HH:MM:SS.
- Type
(time: number) => string
LiveYAxis
minGap?number
Minimum gap in px between labels.
- Default
36
position?"left" | "right"
Side of the plot the labels sit on.
- Type
"left" | "right"- Default
"left"
formatValue?(value: number) => string
Formats a tick value into its label. Defaults to the LiveLine formatValue.
- Type
(value: number) => string
allowDecimals?boolean
Allow fractional tick values.
- Default
true