Live Line Chart Examples
9 live line charts: a streaming price, momentum colors, a pause button, target bands, textured backgrounds and a loading state. Each on React, Vue, Svelte and Solid, drawn with TanStack Charts in your theme. Live line chart docs and API.
Every live line chart example
9 examples.
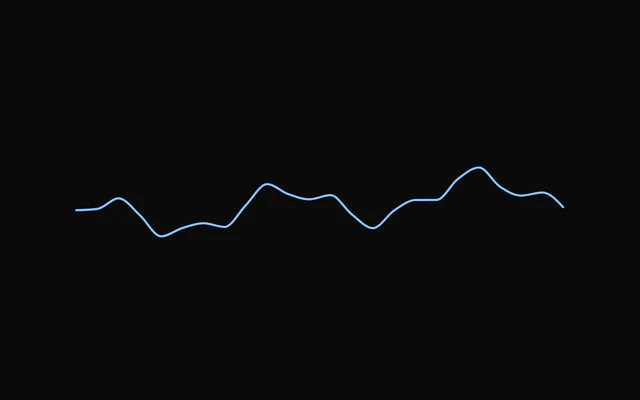
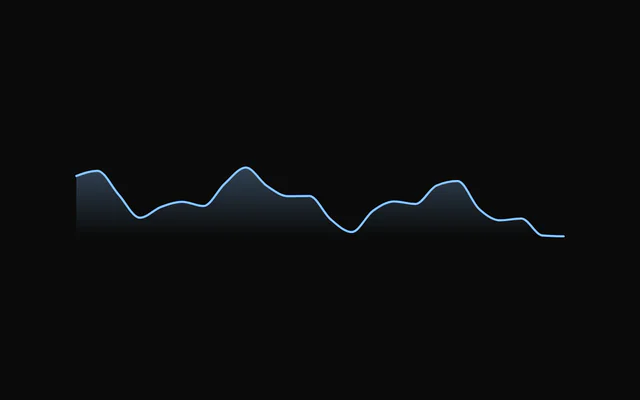
- Live Line ChartLive line chartShare price ticks every 600 ms, with a pulsing live dot and the latest value in a badge.
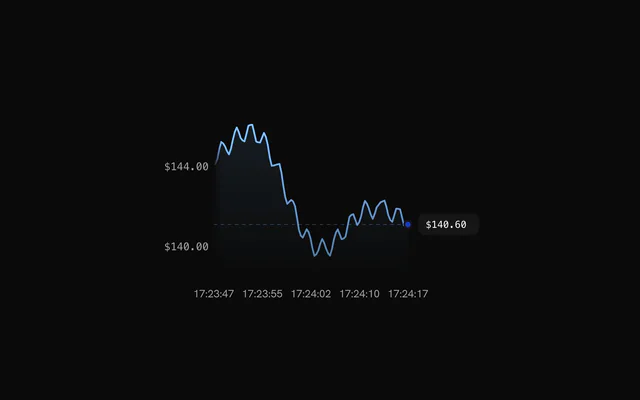
- Live Line Chart with Momentum ColorsLive line chartThe line, fill and dot change color as the index turns up, down or flat.
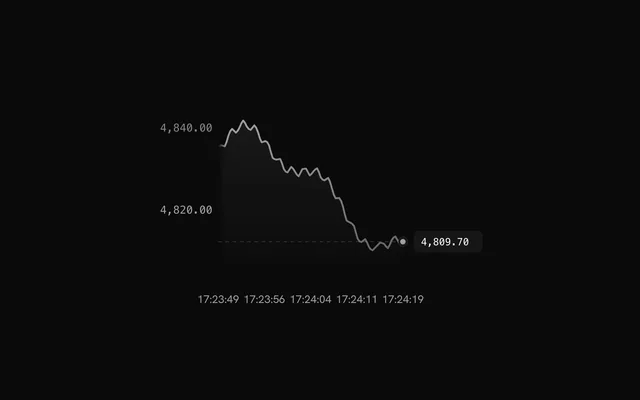
- Live Line Chart with PauseLive line chartPause the scroll to look closer while samples keep arriving, with a tick of room at the edge.
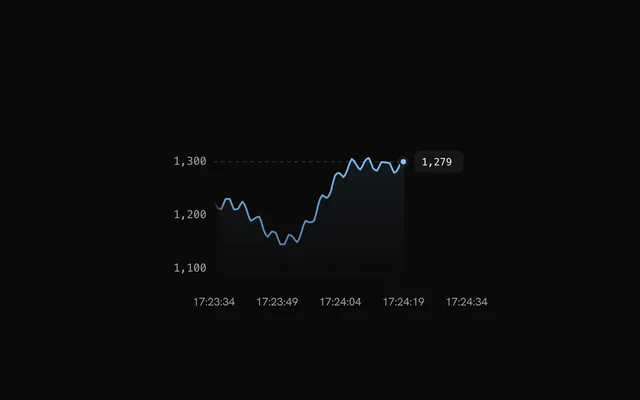
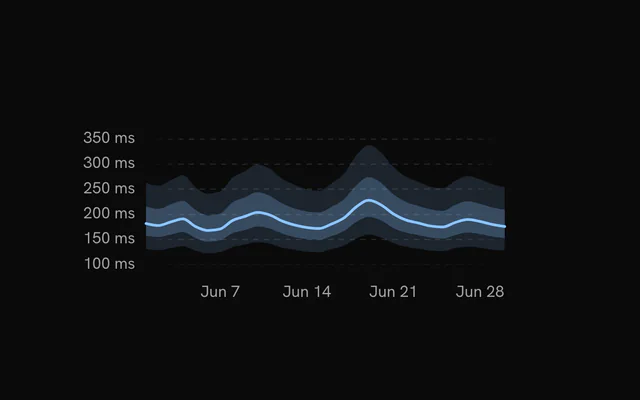
- Live Line Chart with a Right AxisLive line chartAPI latency at p95 as a bare line on a tight range, with its labels on the right.
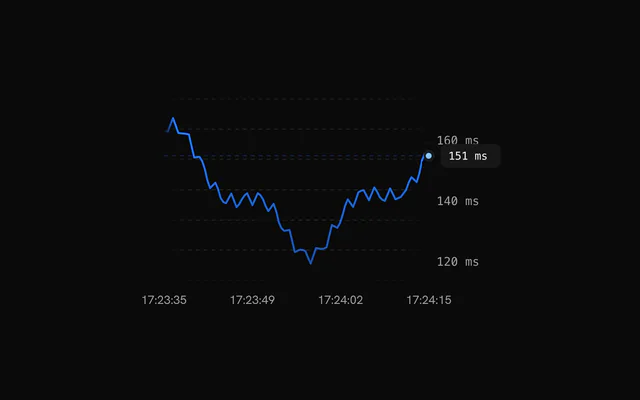
- Live Line Chart with Patterned BackgroundLive line chartFading diagonal lines replace the grid behind the stream.
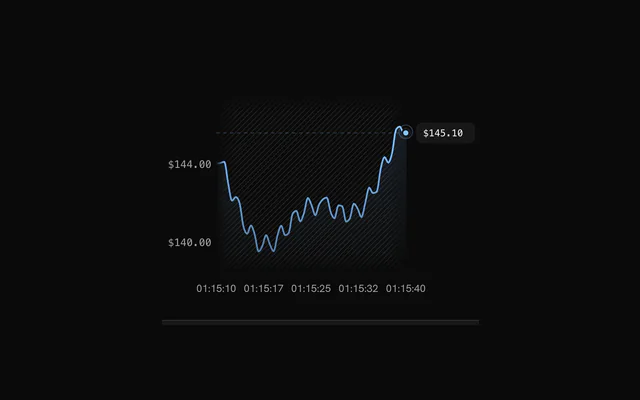
- Live Line Chart with Dot GridLive line chart`<Background pattern="dots" />` in place of the grid, fading out toward the plot's edges.
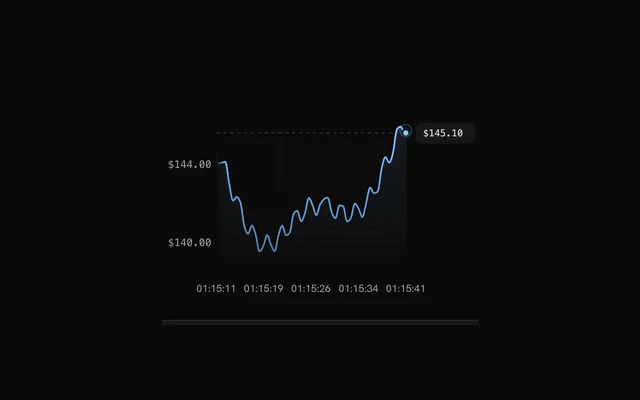
- Live Line Chart with a Target BandLive line chartPrice against a $141 to $144 target band, dashed at the edges and marked with small triangles.
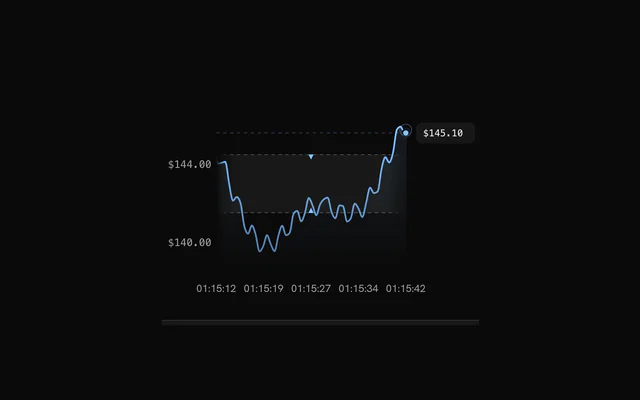
- Live Line Chart with a Hatched BandLive line chartDiagonal hatching fills the target band instead of a flat shade, behind the streaming price.
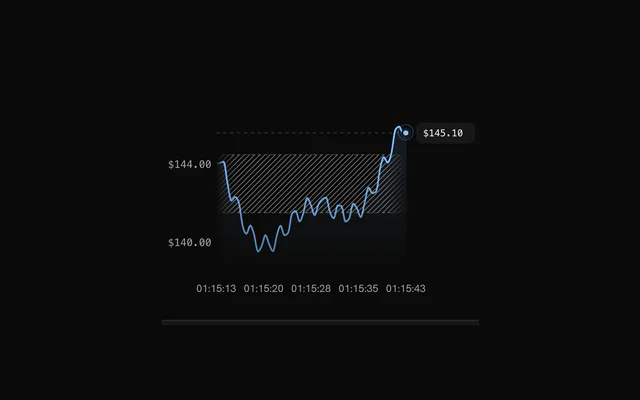
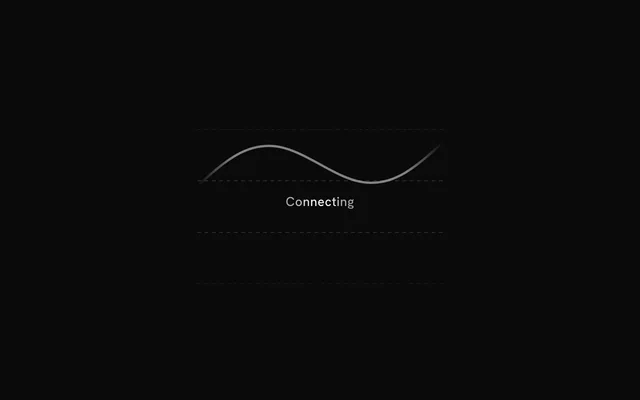
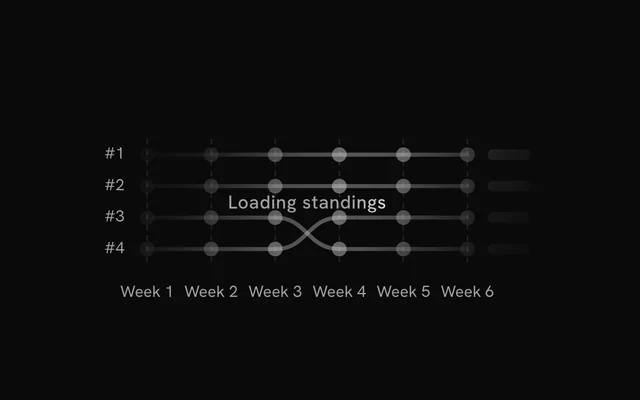
- Live Line Chart Loading StateLive line chartUntil the stream connects, a skeleton line holds the space, then the live chart replaces it.
Or describe it. With Pro, your AI agent installs the live line chart example you describe, on your framework.
Get ProGalleries
More chart examples
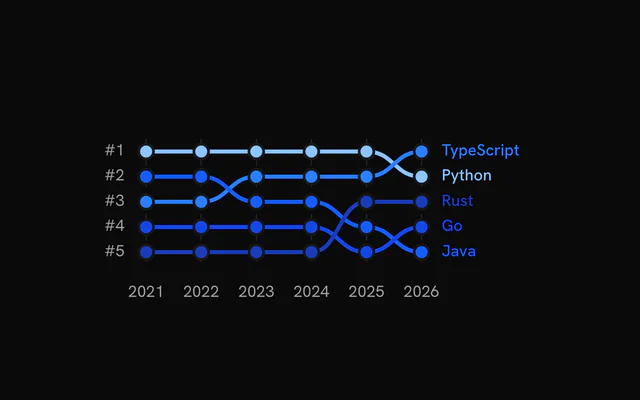
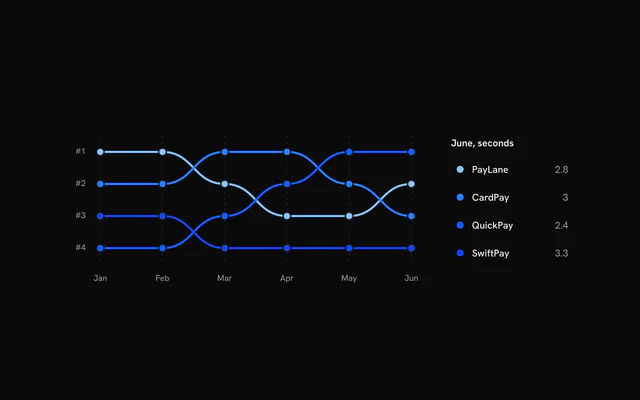
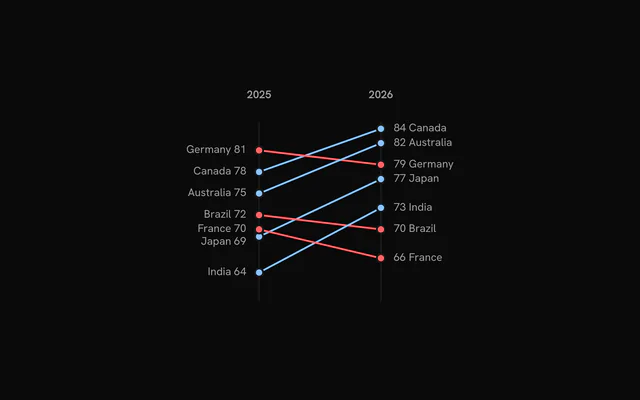
8 more chart types, free: open one for its examples and their code.
Pricing
Live Line Chart examples MCP, with Pro
Your AI agent installs any of the 1434 examples, and every component, block and icon, with every Pro plan.
4.9/5 out of 5 · 150+ reviewsfrom 150+ founders and developers.
- Secure checkout via Stripe
- Code lives in your repo
- Keep what you've shipped if you cancel
- License terms
FAQ
Frequently asked questions
9: Live Line Chart, Live Line Chart with Momentum Colors, Live Line Chart with Pause, Live Line Chart with a Right Axis, Live Line Chart with Patterned Background, Live Line Chart with Dot Grid, Live Line Chart with a Target Band, Live Line Chart with a Hatched Band and Live Line Chart Loading State. Each page has the live chart, its code and a one-line install.
Signed in, copy the chart's command: `npx shadcn@latest add` with its URL. It adds the chart to `components/charts`, the `chart-kit` kit every chart imports, and `@tanstack/charts`. Import the chart and render it.
Yes. Every chart is free to use in personal and commercial projects. Seeing the code and installing it takes a free account, one tap with Google or GitHub. Pro is the site's paid plan for blocks, the Pro collections and the MCP, and the charts don't need it.
4.9 out of 5 from 150+ developers


Every live line chart example. One prompt away.
Every live line chart example is free with an account. With Pro, your AI agent installs them from a prompt.
Get Pro