shadcn.io is an independent project built on shadcn/ui
Installation
Usage
import { ChartRadialPopulation } from "@/components/charts/chart-radial-population";<ChartRadialPopulation />API Reference
RadialChart
datareadonly Record<string, unknown>[]
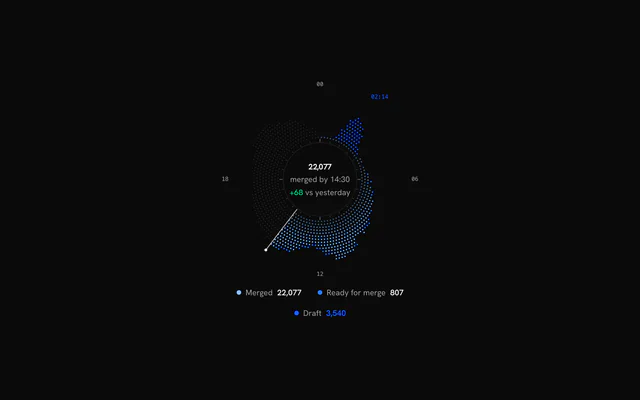
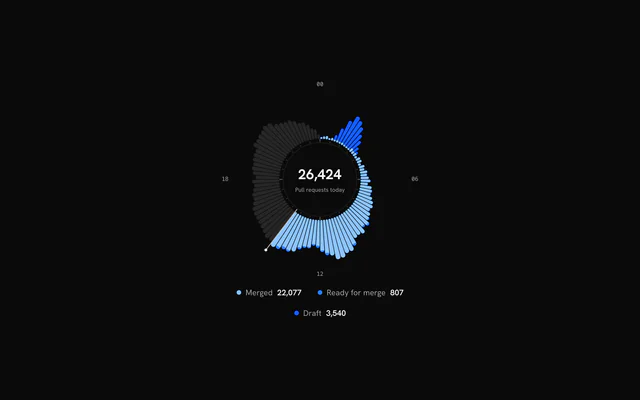
One datum per angular bin, clockwise from the start angle (96 × 15 minutes, say).
- Type
readonly Record<string, unknown>[]
xDataKey?string
Datum key with the bin label, category or time.
- Default
"time"
seriesreadonly RadialSeries[]
Series, innermost (first stacked) first.
layout?Partial<RadialLayout>
Override ring radii (fractions of the chart radius).
- Type
Partial<RadialLayout>
angleType?RadialAngleType
What the angle encodes.
- Default
"clock"
orientation?RadialOrientation
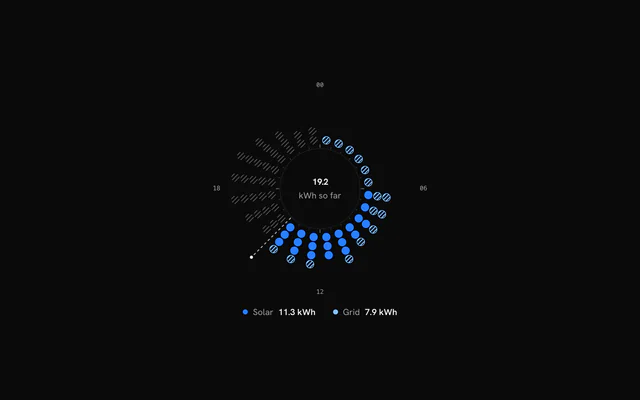
Bins along the angle, or as concentric rings.
- Default
"radial"
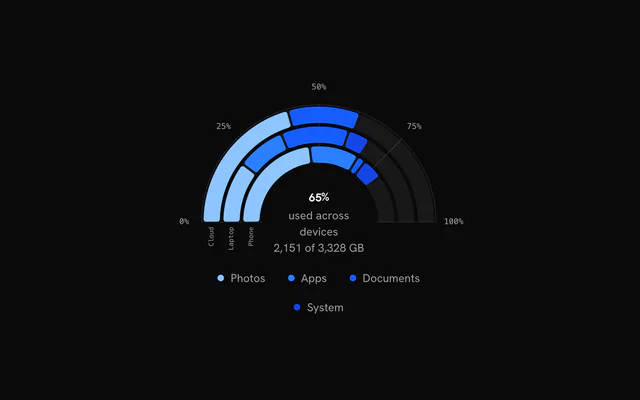
startAngle?number
Arc start in degrees, 0 at 12 o'clock, clockwise.
- Default
0
endAngle?number
Arc end in degrees.
- Default
startAngle + 360 (the full circle)
fitArc?boolean
Crop the stage to the arc's bounding box for partial arcs (a semicircle is about twice as wide as tall).
- Default
true
trackNow?boolean
Track "now": bins after the last bin with data are future bins (ghost data; the scrubber rests at now).
- Default
true for clock charts
nowIndex?number
The bin the resting scrubber points at.
- Default
the last bin with data
maxValue?RadialMaxValue
Shared value scale for every layer without its own maxValue (it also drives RadialAxis value rings). Unset, each layer scales itself (angular charts default to "stacked").
minValue?number | "auto"
Value mapped to the band base; "auto" is the smallest value.
- Type
number | "auto"- Default
0
valueKeys?readonly string[]
Extra datum keys (not series) in the automatic domain, "yesterday" say.
niceValues?boolean
Round an automatic domain to nice tick values.
- Default
true
ringGap?number
angular orientation: the gap between rings as a fraction of a ring step.
- Default
0.3
animate?boolean
Enter animations; skipped under prefers-reduced-motion.
- Default
true
hoveredIndex?number | null
Controlled hovered bin: null is "nothing hovered", absent leaves the hover to the chart.
- Type
number | null
onHoverChange?(index: number | null) => void
Called with the hovered bin (pointer or keyboard), and null when the hover leaves.
- Type
(index: number | null) => void
maxWidth?number
Maximum chart width in px.
- Default
640
className?string
Class names on the chart's outer element.
ariaLabel?string
Accessible name of the chart.
- Default
"Radial chart"
ariaDescription?string
Longer accessible description of the chart.
children?ReactNode
The chart's layers (RadialAxis, RadialDotBar, RadialBar, RadialRingBar, RadialLine, RadialArea, RadialScrubber), drawn in a group centred on the chart in the order given; RadialCenter draws as HTML in the hole and RadialLegend below the chart.
RadialBar
ghostDataKey?string
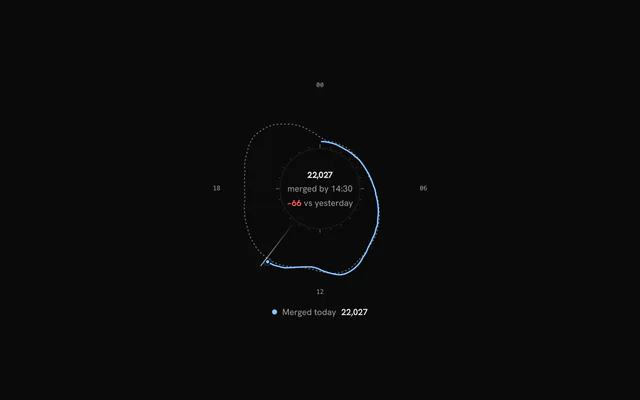
Datum key of a comparison value (yesterday's total, say), drawn as a dim "ghost" bar in bins where no series has a value.
ghostColor?string
Ghost bar colour.
- Default
"var(--foreground)"
ghostOpacity?number
Ghost bar opacity.
- Default
0.12
maxValue?number
Value mapped to the band top. Defaults to the chart's shared scale when RadialChart has maxValue, else the largest stack or ghost value.
padAngle?number
Angular gap between neighbouring bars in radians, held at a constant width from the band base outward. Defaults to 18% of one bin's angle.
cornerRadius?number
Corner radius in px.
- Default
0
stackGap?number
Radial gap in px between stacked segments. 0 draws each bin as one solid column whose outline carries cornerRadius; above 0 every segment is rounded on its own.
- Default
0
rampExtent?number
Fraction of the band over which rampFrom series reach full opacity.
- Default
0.6
fadedOpacity?number
Opacity of the other bins while a bin is hovered.
- Default
0.35
seriesFadedOpacity?number
Opacity of the other series while a legend item is hovered.
- Default
0.2
RadialAxis
showCircle?boolean
Centre circle with a thin stroke.
- Default
true
centerGradient?boolean
Faint radial-gradient fill inside the centre circle.
- Default
false
tickCount?number
Tick marks just outside the centre circle.
- Default
24 for clock charts, else 0
majorTickEvery?number
Every n-th tick is long.
- Default
6 (00 / 06 / 12 / 18)
labels?readonly string[] | false
Labels spaced evenly along the arc from the start angle, or false to hide them. Defaults to 00 / 06 / 12 / 18 (clock), every category (band), time ticks (time) or value ticks (angular).
- Type
readonly string[] | false
labelColor?string
Label colour.
- Default
"var(--muted-foreground)"
stroke?string
Circle, tick and grid colour.
- Default
"var(--foreground)"
labelOrientation?RadialLabelOrientation
Label orientation.
- Default
"radial" for band charts, else "horizontal"
labelRadius?number
Label radius as a fraction of the chart radius. Defaults to layout.axisLabel (rotated band labels start just outside the band).
labelEvery?number
Band charts: label every n-th category.
- Default
1
labelFormat?(value: unknown, index: number) => string
Band charts: formats datum[xDataKey]. Defaults to String(value).
- Type
(value: unknown, index: number) => string
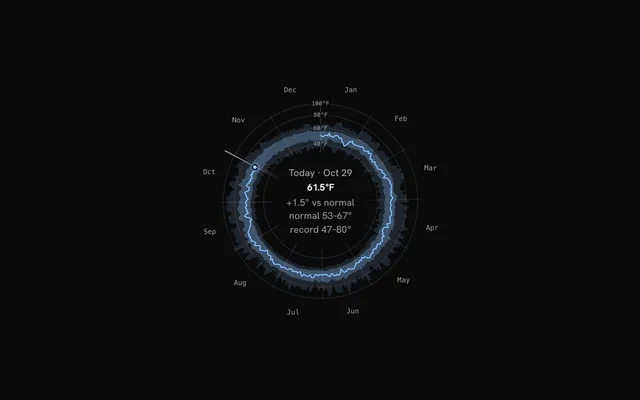
timeTicks?number | readonly (Date | number)[]
Time charts: a tick count hint, or explicit tick times.
- Type
number | readonly (Date | number)[]- Default
12
timeTickFormat?(date: Date) => string
Time charts: the tick label format. Defaults to the short month (UTC) for spans over 60 days.
- Type
(date: Date) => string
timeLabelPosition?"tick" | "between"
Time charts: the label at the tick, or centred between ticks (month names in the middle of their month).
- Type
"tick" | "between"- Default
"between"
angleGrid?boolean
Spokes across the value band at every angle tick (time ticks, or value ticks on angular charts).
- Default
true for time and angular charts
valueTicks?number | readonly number[]
Value grid: a tick count hint or explicit values. Radial charts draw a ring (an arc on partial charts) per value; angular charts use them as the angle ticks. Defaults to none on radial charts and 5 on angular charts.
- Type
number | readonly number[]
valueTickFormat?(value: number) => string
Value tick label format. Defaults to an en-US number.
- Type
(value: number) => string
showValueLabels?boolean
Show value tick labels.
- Default
true
valueLabelAngle?number
Radial charts: the angle (degrees) the value labels sit at. Defaults to the start angle.
showRingLabels?boolean
Angular charts: category labels at the start of each ring.
- Default
true
gridOpacity?number
Grid ring and spoke opacity.
- Default
0.12
RadialCenter
children?(state: RadialCenterState) => ReactNode
Full control over the centre content (at rest and while hovering).
- Type
(state: RadialCenterState) => ReactNode
className?string
Class names on the centre's content box.
prefix?stringsuffix?stringlabelClassName?string
Class names of the label.
valueClassName?string
Class names of the value.
formatOptions?ChartStatFlowFormat
Number format of the value.
defaultLabel?string
The label under the value at rest.
- Default
"Total"
ChartStatFlow
valuenumber
The number to show.
labelstring
Caption shown below the number.
formatOptions?ChartStatFlowFormat
How the number is formatted.
- Default
{ notation: "standard", maximumFractionDigits: 0 }
prefix?string
Text placed before the number, for example "$".
suffix?string
Text placed after the number, for example "%".
valueClassName?string
Class names that replace the default number style.
labelClassName?string
Class names that replace the default label style.
icon?ReactNode
Icon shown in a circle above the number.
RadialLegend
className?string
Class names on the legend row.
formatValue?(value: number) => string
Formats the per-series totals. Defaults to an en-US integer.
- Type
(value: number) => string
showValues?boolean
Show each series' total after its label; turn it off where totals are meaningless (temperatures, say).
- Default
true