shadcn.io is an independent project built on shadcn/ui
Installation
Usage
import { ChartRadialSeasonalCard } from "@/components/charts/chart-radial-seasonal-card";<ChartRadialSeasonalCard />API Reference
RadialChart
datareadonly Record<string, unknown>[]
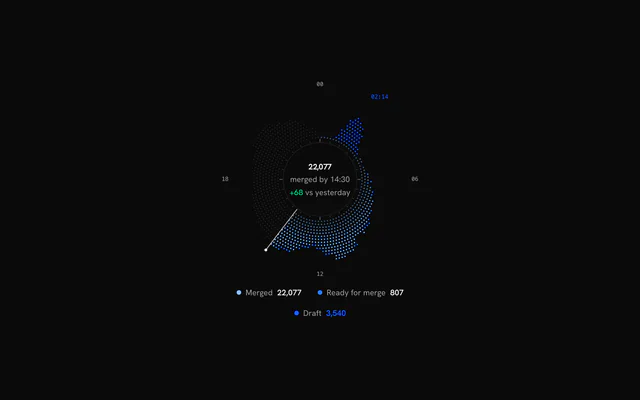
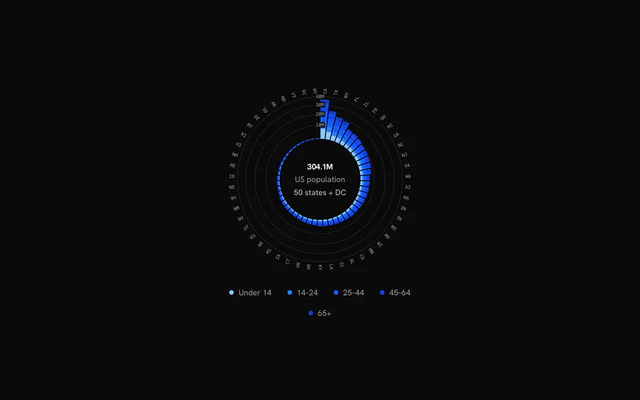
One datum per angular bin, clockwise from the start angle (96 × 15 minutes, say).
- Type
readonly Record<string, unknown>[]
xDataKey?string
Datum key with the bin label, category or time.
- Default
"time"
seriesreadonly RadialSeries[]
Series, innermost (first stacked) first.
layout?Partial<RadialLayout>
Override ring radii (fractions of the chart radius).
- Type
Partial<RadialLayout>
angleType?RadialAngleType
What the angle encodes.
- Default
"clock"
orientation?RadialOrientation
Bins along the angle, or as concentric rings.
- Default
"radial"
startAngle?number
Arc start in degrees, 0 at 12 o'clock, clockwise.
- Default
0
endAngle?number
Arc end in degrees.
- Default
startAngle + 360 (the full circle)
fitArc?boolean
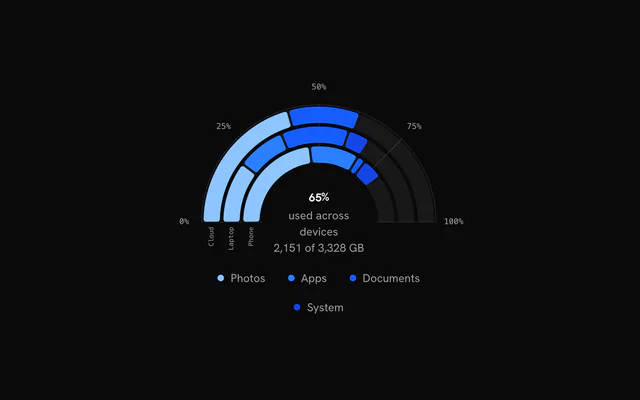
Crop the stage to the arc's bounding box for partial arcs (a semicircle is about twice as wide as tall).
- Default
true
trackNow?boolean
Track "now": bins after the last bin with data are future bins (ghost data; the scrubber rests at now).
- Default
true for clock charts
nowIndex?number
The bin the resting scrubber points at.
- Default
the last bin with data
maxValue?RadialMaxValue
Shared value scale for every layer without its own maxValue (it also drives RadialAxis value rings). Unset, each layer scales itself (angular charts default to "stacked").
minValue?number | "auto"
Value mapped to the band base; "auto" is the smallest value.
- Type
number | "auto"- Default
0
valueKeys?readonly string[]
Extra datum keys (not series) in the automatic domain, "yesterday" say.
niceValues?boolean
Round an automatic domain to nice tick values.
- Default
true
ringGap?number
angular orientation: the gap between rings as a fraction of a ring step.
- Default
0.3
animate?boolean
Enter animations; skipped under prefers-reduced-motion.
- Default
true
hoveredIndex?number | null
Controlled hovered bin: null is "nothing hovered", absent leaves the hover to the chart.
- Type
number | null
onHoverChange?(index: number | null) => void
Called with the hovered bin (pointer or keyboard), and null when the hover leaves.
- Type
(index: number | null) => void
maxWidth?number
Maximum chart width in px.
- Default
640
className?string
Class names on the chart's outer element.
ariaLabel?string
Accessible name of the chart.
- Default
"Radial chart"
ariaDescription?string
Longer accessible description of the chart.
children?ReactNode
The chart's layers (RadialAxis, RadialDotBar, RadialBar, RadialRingBar, RadialLine, RadialArea, RadialScrubber), drawn in a group centred on the chart in the order given; RadialCenter draws as HTML in the hole and RadialLegend below the chart.
RadialAxis
showCircle?boolean
Centre circle with a thin stroke.
- Default
true
centerGradient?boolean
Faint radial-gradient fill inside the centre circle.
- Default
false
tickCount?number
Tick marks just outside the centre circle.
- Default
24 for clock charts, else 0
majorTickEvery?number
Every n-th tick is long.
- Default
6 (00 / 06 / 12 / 18)
labels?readonly string[] | false
Labels spaced evenly along the arc from the start angle, or false to hide them. Defaults to 00 / 06 / 12 / 18 (clock), every category (band), time ticks (time) or value ticks (angular).
- Type
readonly string[] | false
labelColor?string
Label colour.
- Default
"var(--muted-foreground)"
stroke?string
Circle, tick and grid colour.
- Default
"var(--foreground)"
labelOrientation?RadialLabelOrientation
Label orientation.
- Default
"radial" for band charts, else "horizontal"
labelRadius?number
Label radius as a fraction of the chart radius. Defaults to layout.axisLabel (rotated band labels start just outside the band).
labelEvery?number
Band charts: label every n-th category.
- Default
1
labelFormat?(value: unknown, index: number) => string
Band charts: formats datum[xDataKey]. Defaults to String(value).
- Type
(value: unknown, index: number) => string
timeTicks?number | readonly (Date | number)[]
Time charts: a tick count hint, or explicit tick times.
- Type
number | readonly (Date | number)[]- Default
12
timeTickFormat?(date: Date) => string
Time charts: the tick label format. Defaults to the short month (UTC) for spans over 60 days.
- Type
(date: Date) => string
timeLabelPosition?"tick" | "between"
Time charts: the label at the tick, or centred between ticks (month names in the middle of their month).
- Type
"tick" | "between"- Default
"between"
angleGrid?boolean
Spokes across the value band at every angle tick (time ticks, or value ticks on angular charts).
- Default
true for time and angular charts
valueTicks?number | readonly number[]
Value grid: a tick count hint or explicit values. Radial charts draw a ring (an arc on partial charts) per value; angular charts use them as the angle ticks. Defaults to none on radial charts and 5 on angular charts.
- Type
number | readonly number[]
valueTickFormat?(value: number) => string
Value tick label format. Defaults to an en-US number.
- Type
(value: number) => string
showValueLabels?boolean
Show value tick labels.
- Default
true
valueLabelAngle?number
Radial charts: the angle (degrees) the value labels sit at. Defaults to the start angle.
showRingLabels?boolean
Angular charts: category labels at the start of each ring.
- Default
true
gridOpacity?number
Grid ring and spoke opacity.
- Default
0.12
RadialArea
dataKey?string
Draw a single area for this datum key (a matching series supplies colour, opacity and legend dimming). Omit to draw every chart series.
baseDataKey?string
Inner edge of a single area (a min/max band, say). Defaults to the band base (0).
stacked?boolean
Series mode: stack the series outward, or overlay them from the base.
- Default
true
color?string
Fill and stroke colour of a single area. Defaults to the series colour (else its palette slot), else var(--foreground).
fill?boolean
Draw the fill (false gives an outline-only line).
- Default
true
fillOpacity?number
Fill opacity at the outer edge.
- Default
0.32
rampFrom?number
Radial gradient: the fraction of fillOpacity at the band base, rising to the full value at the outer radius. Defaults to the series' rampFrom, else 0.25.
stroke?RadialAreaStroke
Which edges get a stroke.
- Default
"outer"
strokeWidth?number
Stroke width in px.
- Default
1.5
strokeOpacity?number
Stroke opacity.
- Default
1
strokeDasharray?string
A dashed edge: "4 4", say.
curve?RadialAreaCurve
The curve through the bin centres.
- Default
"catmullRom"
ghostDataKey?string
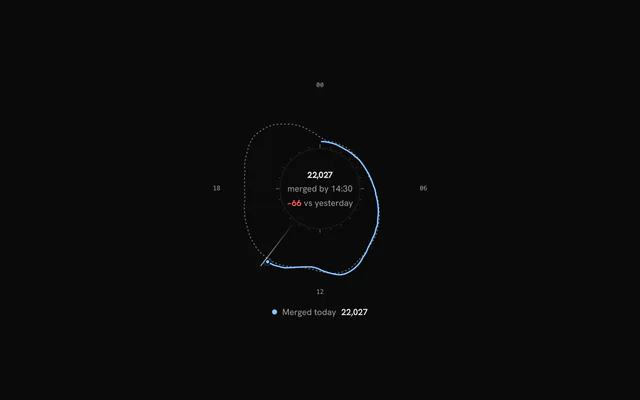
Datum key of a comparison value (yesterday's total, say), drawn as a dim "ghost" area with a dashed edge in bins where no series has a value.
ghostColor?string
Ghost colour.
- Default
"var(--foreground)"
ghostOpacity?number
Ghost fill opacity (its stroke is 2.5× this).
- Default
0.1
maxValue?number
Value mapped to the outer radius. Defaults to the chart's shared scale when RadialChart has maxValue, else the largest drawn value.
activeDot?boolean
A dot on the outer edge of the hovered bin, riding the edge.
- Default
true
activeDotMotion?RadialDotMotion
How the active dot follows the pointer: locked to the crosshair, its own spring (activeDotSpring) or snapping to the bin. Reduced motion always snaps.
- Default
"crosshair"
activeDotSpring?RadialSpringOptions
activeDotMotion="spring": the dot's spring.
- Default
{ stiffness: 240, damping: 24 }
fadedOpacity?number
Opacity of the other series while a legend item is hovered.
- Default
0.2
RadialLine
dataKeystring
Datum key plotted by this line. A key matching a RadialChart series inherits its colour and opacity and dims with the legend; any other key ("yesterday") draws a comparison line.
stroke?string
Stroke colour. Defaults to the series colour (else its palette slot), else var(--foreground).
strokeWidth?number
Stroke width in px.
- Default
2
strokeOpacity?number
Stroke opacity. Defaults to the series opacity, else 1.
dash?boolean | string
Dash pattern: true for strokeWidth dashes with 3× gaps, or any SVG stroke-dasharray. Defaults to solid.
- Type
boolean | string
curve?CurveFactory
d3 curve. Defaults to curveCatmullRomClosed for a closed loop, else curveCatmullRom.
closed?boolean
Join the last bin back to the first. Defaults to true when every bin has a value on a full circle.
maxValue?number
Value mapped to the band top. Defaults to the chart's shared scale when RadialChart has maxValue, else the largest value across every series and this line.
showMarkers?boolean
A point marker on the hovered bin, riding the line.
- Default
true
markerMotion?RadialDotMotion
How the hover marker follows the pointer: locked to the crosshair, its own spring (markerSpring) or snapping to the bin. Reduced motion always snaps.
- Default
"crosshair"
markerSpring?RadialSpringOptions
markerMotion="spring": the marker's spring.
- Default
{ stiffness: 240, damping: 24 }
showNowMarker?boolean
A marker at the line's last value ("now"). Defaults to true for open lines.
pulse?boolean
A soft pulse around the "now" marker (off under reduced motion).
- Default
true
markerRadius?number
Marker radius in px. Defaults to a size that scales with the chart.
fadedOpacity?number
Opacity while another series is hovered in the legend.
- Default
0.2
enterDelay?number
Delay before the clockwise draw starts, in seconds.
- Default
0
RadialScrubber
variant?RadialScrubberVariant
Line style.
- Default
"solid"
dashArray?string
dashed variant: the SVG stroke-dasharray.
- Default
"4 4"
showDot?boolean
End dot. Defaults to true for solid and dashed lines, false for the gradient.
color?string
Line and dot colour.
- Default
"var(--foreground)"
lineOpacity?number
Line opacity.
- Default
0.7
strokeWidth?number
Line width.
- Default
1.5
dotRadius?number
End dot radius in px. Defaults to a size that scales with the chart.
rest?"now" | "hidden"
Where the scrubber rests when nothing is hovered: at "now" (the trailing edge of nowIndex) or hidden. Defaults to "now" on charts that track now (clock charts), else "hidden".
- Type
"now" | "hidden"
spring?RadialSpringOptions
The spring toward the hovered bin; hover dots locked to the crosshair follow it too.
- Default
{ stiffness: 420, damping: 42 }