shadcn.io is an independent project built on shadcn/ui
Installation
Usage
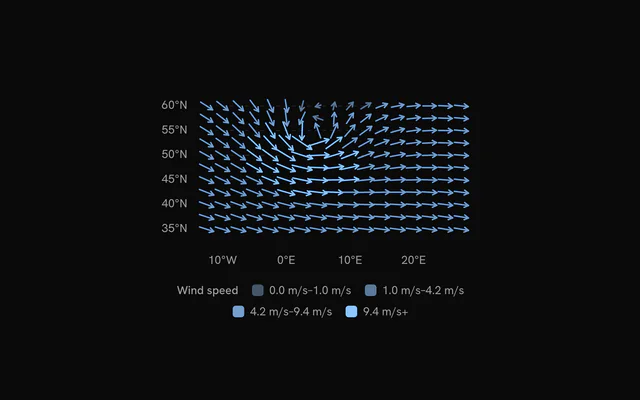
import { ChartVectorFieldStations } from "@/components/charts/chart-vector-field-stations";<ChartVectorFieldStations />API Reference
VectorFieldChart
datareadonly SpatialRow[]
The samples: one row per arrow, at its x and y.
xDataKeystring
Key of each sample's horizontal position.
yDataKeystring
Key of each sample's vertical position.
xDomain?readonly [number, number]
The x range shown. Defaults to the data's, rounded out to nice values.
yDomain?readonly [number, number]
The y range shown. Defaults to the data's, rounded out to nice values.
aspectRatio?string
Aspect ratio of the chart as "width / height".
- Default
"16 / 9"
margin?Partial<SpatialMargin>
Space around the plot in pixels. Any side you omit keeps its default.
- Type
Partial<SpatialMargin>
animate?boolean
Play the entrance animation.
- Default
true
animationDuration?number
Length of the entrance sweep in milliseconds: the time from the first mark starting to the last one.
- Default
900
revealSignature?string
Changing this value replays the entrance animation.
status?ChartStatus
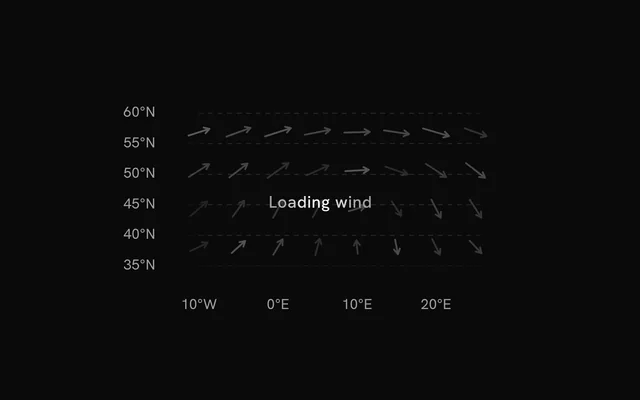
"loading" draws a pulsing skeleton of the chart's shape in place of its marks (the axes, grid and land stay) and ignores the pointer; switching to "ready" plays the entrance.
- Default
"ready"
loadingLabel?string
Text shown centered over the chart, with a shimmer, while status is "loading". Nothing is shown when it is unset or empty.
className?string
Additional class name for the chart container.
children?ReactNode
The chart's carriers: its layers, axes, grid, tooltip and legend.
ariaLabel?string
Accessible label of the chart.
ariaDescription?string
Longer accessible description of the chart.
VectorFieldGrid
horizontal?boolean
Show horizontal grid lines, at the y axis's ticks.
- Default
true
vertical?boolean
Show vertical grid lines, at the x axis's ticks.
- Default
false
stroke?string
Color of the grid lines.
- Default
"var(--chart-grid)"
strokeDasharray?string
Dash pattern of the grid lines.
- Default
"4 4"
VectorFieldArrows
uDataKey?string
Key of each sample's horizontal component (east, +x). With vDataKey it gives the direction and the magnitude.
- Default
"u"
vDataKey?string
Key of each sample's vertical component (north, +y).
- Default
"v"
angleDataKey?string
Key of each sample's direction in degrees, clockwise from up (north): used with magnitudeDataKey in place of u and v.
magnitudeDataKey?string
Key of each sample's magnitude, with angleDataKey.
maxLength?number
Length of the strongest arrow, in pixels; the others by the square root of their magnitude.
- Default
22
color?string
One color for every arrow. Defaults to steps of the sequential scale by magnitude.
colors?readonly string[]
The fills by magnitude, lowest first, without color.
- Default
the sequential scale `var(--chart-scale-02)` … `var(--chart-scale-05)`
strokeWidth?number
Width of the arrows, in pixels.
- Default
1.5
inactiveOpacity?number
Opacity of the other marks while one is hovered or focused.
- Default
0.3
fadeOnHover?boolean
Dim the layer's other marks while one is hovered or focused.
- Default
true
VectorFieldXAxis
numTicks?number
Target number of tick labels.
- Default
5
formatValue?(value: number) => string
Formats a tick value into its label. Defaults to the number, thousands abbreviated (2k).
- Type
(value: number) => string
label?string
A title for the axis, drawn beside its labels.
VectorFieldYAxis
numTicks?number
Target number of tick labels.
- Default
5
formatValue?(value: number) => string
Formats a tick value into its label. Defaults to the number, thousands abbreviated (2k).
- Type
(value: number) => string
label?string
A title for the axis, drawn beside its labels.
VectorFieldTooltip
content?(args: VectorFieldTooltipArgs) => ReactNode
Custom tooltip content. Replaces the default title and rows, inside the same panel.
- Type
(args: VectorFieldTooltipArgs) => ReactNode
formatValue?(value: number) => string
Formats the value row of the default content.
- Type
(value: number) => string- Default
the number with thousands separators
valueLabel?string
The label of the value row of the default content.
className?string
Additional class name for the tooltip panel.
panelStyle?CSSProperties
Inline styles merged onto the tooltip panel.
backgroundColor?string
Background color of the tooltip panel. Overrides the theme's popover color.