shadcn.io is an independent project built on shadcn/ui
Installation
The command adds the example above to components/charts/ and, the first time, the chart kit to components/ui/charts/. Both are source files in your project from then on: read them, change them, delete what you don't use.
Usage
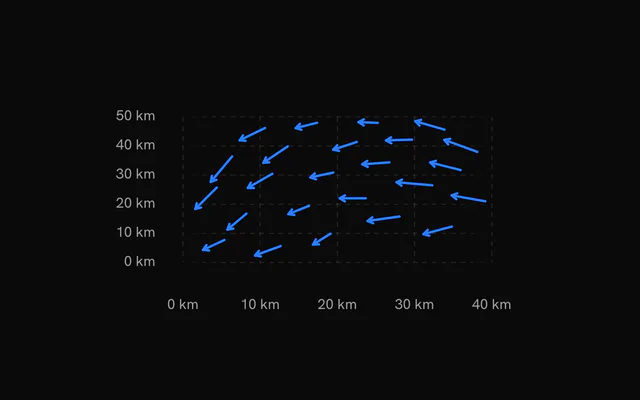
Each row is one arrow: its position under xDataKey and yDataKey, and its vector as u (east) and v (north). The samples don't need to form a grid.
import {
  VectorFieldArrows,
  VectorFieldChart,
  VectorFieldTooltip,
  VectorFieldXAxis,
  VectorFieldYAxis,
} from "@/components/ui/charts";

const wind = [
  { u: 4.2, v: 1.1, x: 0, y: 0 },
  { u: 5, v: 0.4, x: 10, y: 0 },
  { u: 3.1, v: 2.6, x: 0, y: 10 },
  { u: 3.8, v: 1.9, x: 10, y: 10 },
];

export const WindChart = () => (
  <VectorFieldChart ariaLabel="Surface wind" data={wind} xDataKey="x" yDataKey="y">
    <VectorFieldArrows />
    <VectorFieldXAxis />
    <VectorFieldYAxis />
    <VectorFieldTooltip valueLabel="Speed" />
  </VectorFieldChart>
);
Anatomy
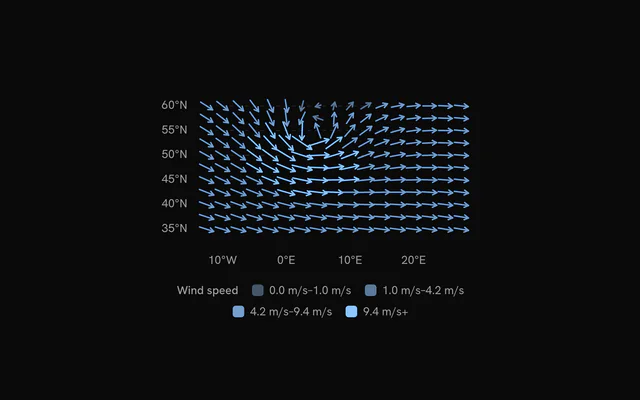
Each arrow is centered on its sample and drawn over the grid. The axes, tooltip and legend are optional.
<VectorFieldChart data={wind} xDataKey="longitude" yDataKey="latitude">
  <VectorFieldGrid />
  <VectorFieldArrows />
  <VectorFieldXAxis />
  <VectorFieldYAxis />
  <VectorFieldTooltip valueLabel="Speed" />
  <VectorFieldLegend title="Wind speed" />
</VectorFieldChart>VectorFieldChart: Holds the samples and sets up the x and y scales.VectorFieldGrid: Dashed guide lines, horizontal unless you addvertical.VectorFieldArrows: An arrow per sample, fromuandvor from an angle and a magnitude.VectorFieldXAxis: Tick labels along the bottom, formatted withformatValue.VectorFieldYAxis: Tick labels on the left, formatted withformatValue.VectorFieldTooltip: The sample's position, magnitude and compass direction.VectorFieldLegend: The magnitude steps and their colors. Left out when the arrows have onecolor.
Length and color
An arrow's length follows the square root of its magnitude: the strongest is maxLength long (22 px) and one a quarter as strong is half that. Colors step through --chart-scale-02 to --chart-scale-05, and <VectorFieldLegend> names the ranges.
Lengths are in pixels, not data units, so arrows keep their size on a small screen. A dense grid crowds on a phone, so send fewer samples to narrow layouts.
Components or angles
By default u and v on each row are the east and north components. If your data has a heading and a speed instead, pass angleDataKey and magnitudeDataKey. The angle is where the arrow points, in degrees clockwise from up.
Weather data usually gives the direction wind blows from. Add 180° to it first, or the arrows point upwind.
Customization
The kit is in your project, in components/ui/charts/: your framework's components over a shared core/. Change a default there and every chart picks it up.
className goes on the chart's container, so size and spacing are utility classes.
content on <VectorFieldTooltip> gets the hovered vector: its row, its magnitude and its angle in degrees clockwise from up. Use the row for anything else you keep on it, like a station's name.
On the arrows, strokeWidth (1.5 px) sets their weight, and colors replaces the steps they're colored by.
<VectorFieldTooltip
  content={({ vector }) => (
    <div className="px-3 py-2 text-sm">
      {String(vector.row.name)}: {vector.magnitude} km/h
    </div>
  )}
/>
Where a part renders content of its own, you pass it in. In React:
VectorFieldTooltip:content={({ vector, index }) => …}
Loading state
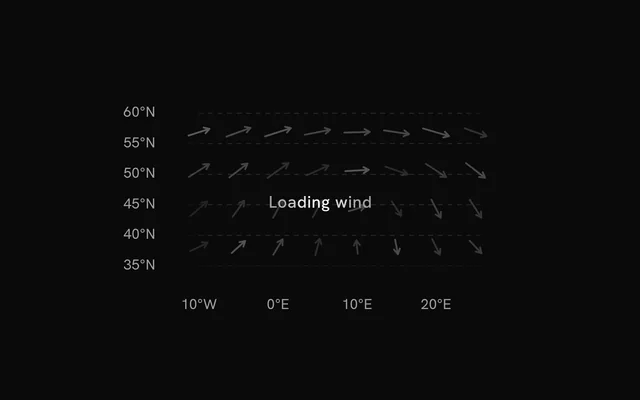
With status="loading", skeleton arrows turning round a slow eddy shimmer in the plot while the axes and grid stay. The pointer is ignored until "ready", when the real arrows sweep in from the left.
loadingLabel puts a short line of text over the skeleton.
Animation
The arrows grow from nothing in a wave from left to right. The wave takes animationDuration (900 ms) to cross the plot and each arrow 450 ms.
Change revealSignature to play it again, for example when a new forecast hour loads. animate={false} and reduced motion both draw the field at rest.
Theming
Every color in the kit is one of your theme's tokens or a mix of them, except --chart-positive, a fixed green. A preset or the .dark class restyles the chart, and overriding a token in your CSS changes it everywhere.
The default steps are mixes of --chart-1 into --muted, so the field follows your theme's first chart color. color on <VectorFieldArrows> draws every arrow in one color, such as var(--chart-2).
| Token | Default | Paints |
|---|---|---|
--chart-1 | your theme's | the first series |
--chart-scale-05 | --chart-1 | the high end of a color scale |
--chart-grid | --border | grid lines |
--chart-label | --muted-foreground | tick labels |
--chart-tooltip-background | --popover | the tooltip panel |
:root {
  --chart-grid: var(--muted);
  --chart-label: var(--foreground);
}
Accessibility
The chart is announced as an image named by ariaLabel ("Vector field" by default). Put the overall flow in ariaDescription, such as "westerly, strongest over the North Sea".
Each arrow takes keyboard focus in turn, left to right. Its tooltip gives the direction as a compass point and in degrees, so it doesn't rely on the arrow's angle alone.
- Tab
- Moves focus to the chart, on its leftmost arrow.
- Arrow Right
- Moves to the next arrow to the right. ArrowDown does the same.
- Arrow Left
- Moves to the previous arrow. ArrowUp does the same.
- Home
- Jumps to the leftmost arrow.
- End
- Jumps to the rightmost arrow.
API reference
VectorFieldChart
datareadonly SpatialRow[]
The samples: one row per arrow, at its x and y.
xDataKeystring
Key of each sample's horizontal position.
yDataKeystring
Key of each sample's vertical position.
xDomain?readonly [number, number]
The x range shown. Defaults to the data's, rounded out to nice values.
yDomain?readonly [number, number]
The y range shown. Defaults to the data's, rounded out to nice values.
aspectRatio?string
Aspect ratio of the chart as "width / height".
- Default
"16 / 9"
margin?Partial<SpatialMargin>
Space around the plot in pixels. Any side you omit keeps its default.
- Type
Partial<SpatialMargin>
animate?boolean
Play the entrance animation.
- Default
true
animationDuration?number
Length of the entrance sweep in milliseconds: the time from the first mark starting to the last one.
- Default
900
revealSignature?string
Changing this value replays the entrance animation.
status?ChartStatus
"loading" draws a pulsing skeleton of the chart's shape in place of its marks (the axes, grid and land stay) and ignores the pointer; switching to "ready" plays the entrance.
- Default
"ready"
loadingLabel?string
Text shown centered over the chart, with a shimmer, while status is "loading". Nothing is shown when it is unset or empty.
className?string
Additional class name for the chart container.
children?ReactNode
The chart's carriers: its layers, axes, grid, tooltip and legend.
ariaLabel?string
Accessible label of the chart.
ariaDescription?string
Longer accessible description of the chart.
VectorFieldArrows
uDataKey?string
Key of each sample's horizontal component (east, +x). With vDataKey it gives the direction and the magnitude.
- Default
"u"
vDataKey?string
Key of each sample's vertical component (north, +y).
- Default
"v"
angleDataKey?string
Key of each sample's direction in degrees, clockwise from up (north): used with magnitudeDataKey in place of u and v.
magnitudeDataKey?string
Key of each sample's magnitude, with angleDataKey.
maxLength?number
Length of the strongest arrow, in pixels; the others by the square root of their magnitude.
- Default
22
color?string
One color for every arrow. Defaults to steps of the sequential scale by magnitude.
colors?readonly string[]
The fills by magnitude, lowest first, without color.
- Default
the sequential scale `var(--chart-scale-02)` … `var(--chart-scale-05)`
strokeWidth?number
Width of the arrows, in pixels.
- Default
1.5
inactiveOpacity?number
Opacity of the other marks while one is hovered or focused.
- Default
0.3
fadeOnHover?boolean
Dim the layer's other marks while one is hovered or focused.
- Default
true
VectorFieldGrid
horizontal?boolean
Show horizontal grid lines, at the y axis's ticks.
- Default
true
vertical?boolean
Show vertical grid lines, at the x axis's ticks.
- Default
false
stroke?string
Color of the grid lines.
- Default
"var(--chart-grid)"
strokeDasharray?string
Dash pattern of the grid lines.
- Default
"4 4"
VectorFieldXAxis
numTicks?number
Target number of tick labels.
- Default
5
formatValue?(value: number) => string
Formats a tick value into its label. Defaults to the number, thousands abbreviated (2k).
- Type
(value: number) => string
label?string
A title for the axis, drawn beside its labels.
VectorFieldYAxis
numTicks?number
Target number of tick labels.
- Default
5
formatValue?(value: number) => string
Formats a tick value into its label. Defaults to the number, thousands abbreviated (2k).
- Type
(value: number) => string
label?string
A title for the axis, drawn beside its labels.
VectorFieldTooltip
content?(args: VectorFieldTooltipArgs) => ReactNode
Custom tooltip content. Replaces the default title and rows, inside the same panel.
- Type
(args: VectorFieldTooltipArgs) => ReactNode
formatValue?(value: number) => string
Formats the value row of the default content.
- Type
(value: number) => string- Default
the number with thousands separators
valueLabel?string
The label of the value row of the default content.
className?string
Additional class name for the tooltip panel.
panelStyle?CSSProperties
Inline styles merged onto the tooltip panel.
backgroundColor?string
Background color of the tooltip panel. Overrides the theme's popover color.
VectorFieldLegend
title?string
A title before the legend's items.
formatValue?(value: number) => string
Formats the values the legend shows.
- Type
(value: number) => string- Default
the number, thousands abbreviated (`2k`)
align?"start" | "center" | "end"
Where the legend sits in the row under the plot.
- Type
"start" | "center" | "end"- Default
"center"
className?string
Additional class name for the legend.
Examples
3 examples on React, each live with its code and its own install command.