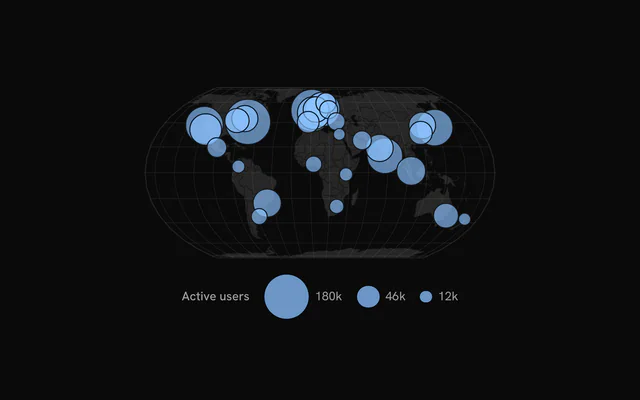
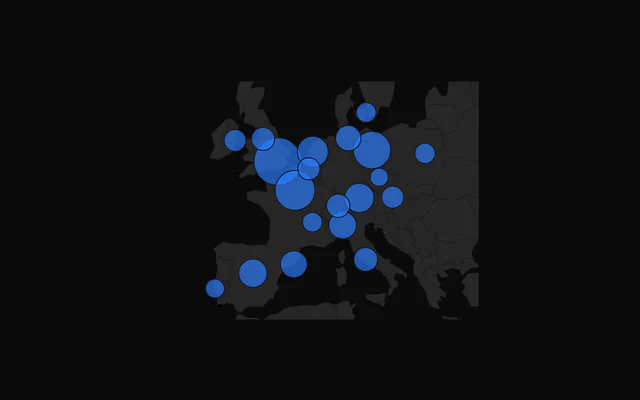
shadcn.io is an independent project built on shadcn/ui
Charting library: TanStack Charts
Installation
Sign in to get your install command
Free with an account. It carries your token, so the CLI installs everything in one go.
Use email insteadNo credit card
Usage
<script setup lang="ts">
import ChartBubbleMapCategories from "@/components/charts/chart-bubble-map-categories.vue";
</script><template>
<ChartBubbleMapCategories />
</template>