shadcn.io is an independent project built on shadcn/ui
Installation
The command adds the example above to components/charts/ and, the first time, the chart kit to components/ui/charts/. Both are source files in your project from then on: read them, change them, delete what you don't use.
Usage
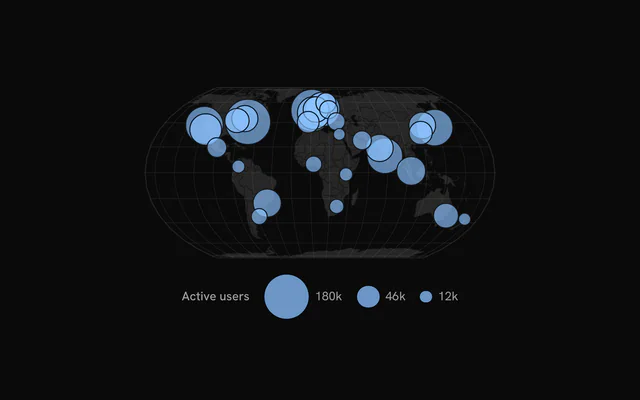
Each row needs a longitude, a latitude and a value, plus a name for the tooltip. The land is worldCountries, 177 countries as GeoJSON, installed in components/charts/data/ with any example that uses it.
<script setup lang="ts">
import { worldCountries } from "@/components/charts/data/world-countries";
import {
  BubbleMapBubbles,
  BubbleMapChart,
  BubbleMapLand,
  BubbleMapTooltip,
} from "@/components/ui/charts";

const cities = [
  { latitude: 40.71, longitude: -74.01, name: "New York", users: 184_200 },
  { latitude: 51.51, longitude: -0.13, name: "London", users: 158_700 },
  { latitude: 35.68, longitude: 139.69, name: "Tokyo", users: 119_600 },
  { latitude: -23.55, longitude: -46.63, name: "São Paulo", users: 71_200 },
];
</script>

<template>
  <BubbleMapChart
    ariaLabel="Active users by city"
    :data="cities"
    :geography="worldCountries"
  >
    <BubbleMapLand />
    <BubbleMapBubbles data-key="users" />
    <BubbleMapTooltip value-label="Active users" />
  </BubbleMapChart>
</template>
Anatomy
The layers stack in a fixed order: the world's outline, the land, the graticule, then the bubbles on top. Leave a part out and it isn't drawn.
<BubbleMapChart :data="cities" :geography="worldCountries">
  <BubbleMapGraticule />
  <BubbleMapLand />
  <BubbleMapBubbles data-key="users" />
  <BubbleMapTooltip value-label="Active users" />
  <BubbleMapLegend title="Active users" />
</BubbleMapChart>BubbleMapChart: Holds the places, the countries and the projection every layer shares.BubbleMapGraticule: Lines of longitude and latitude every 20°, and the world's outline.BubbleMapLand: The countries fromgeography.BubbleMapBubbles: A circle per row, its area set bydataKey.BubbleMapTooltip: The hovered place'snameand value.BubbleMapLegend: Three reference sizes and, withcolorKey, the categories.
Sizing
A bubble's area follows its value, so a city with four times the users gets twice the radius. maxRadius (22 px) is the largest value's size and minRadius (2 px) keeps small ones visible.
Big bubbles are drawn first, so a small one is never hidden under a big one. The pointer picks the smallest bubble it's inside.
Categories
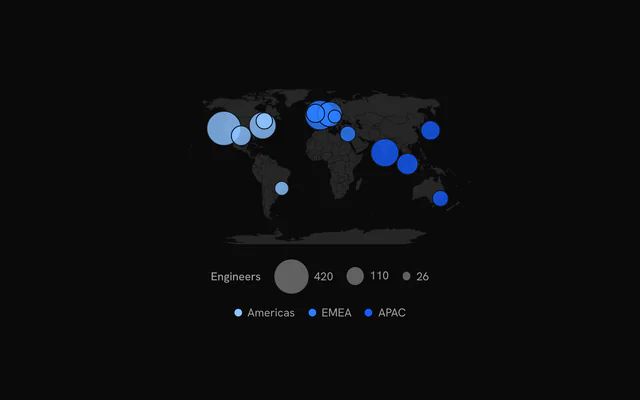
Set colorKey to a field and each distinct value takes the next chart color, in order of appearance. <BubbleMapLegend> then shows the sizes and the categories side by side.
Without colorKey, color sets one fill for every bubble and fillOpacity (0.65) how much of the map shows through.
Regions and projections
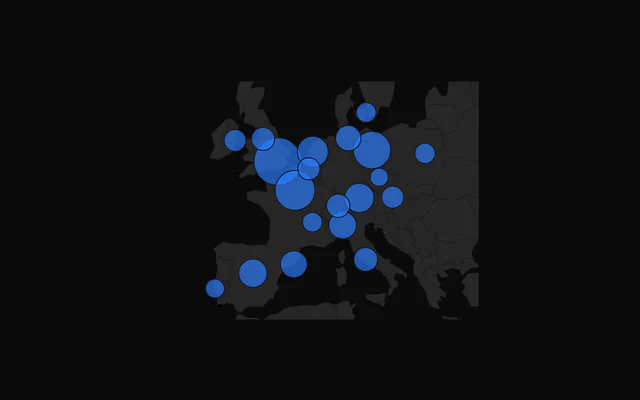
By default the whole world fills the plot. fit="data" zooms to your places, with room for the largest bubble, and fit="geography" fits the features you pass. Countries past the edge are clipped.
projection is "equal-earth" (the default), "natural-earth", "mercator" or "orthographic". :rotate="[-10, 0]" turns the world so 10° east sits in the middle.
Customization
The kit is in your project, in components/ui/charts/: your framework's components over a shared core/. Change a default there and every chart picks it up.
class goes on the chart's container, so size and spacing are utility classes.
geography takes any GeoJSON feature collection, so you can swap the world for a country's states or your own sales regions. <BubbleMapLand> styles it with fill, stroke and strokeWidth.
content on <BubbleMapTooltip> gets the hovered row as bubble, so any field you keep on the row can go in the panel.
<BubbleMapTooltip>
  <template #content="{ bubble }">
    <div class="px-3 py-2 text-sm">
      <div class="font-medium">{{ String(bubble.name) }}</div>
      <div class="text-muted-foreground">
        {{ Number(bubble.users).toLocaleString() }} active users
      </div>
    </div>
  </template>
</BubbleMapTooltip>
Where a part renders content of its own, you pass it in. In Vue:
BubbleMapTooltip:<template #content="{ bubble, index }">
Loading state
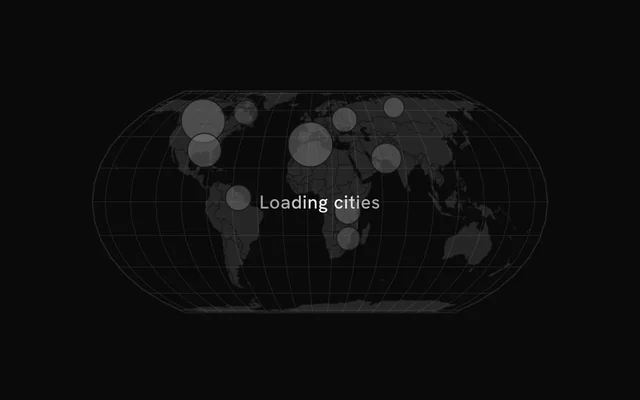
With status="loading" the land stays and skeleton bubbles of different sizes shimmer on it. The pointer is ignored until "ready", when they fade out and the real bubbles grow in.
loadingLabel puts a short line of text over the map.
Animation
The land fades in over 500 ms, then the bubbles grow from their centers, largest first, the stagger spread over animationDuration (900 ms).
Change revealSignature to play it again. :animate="false" and reduced motion both draw the map at rest.
Theming
Every color in the kit is one of your theme's tokens or a mix of them, except --chart-positive, a fixed green. A preset or the .dark class restyles the chart, and overriding a token in your CSS changes it everywhere.
Bubbles default to --chart-1, and categories take --chart-1 to --chart-5 in order. The land is your theme's --muted, its borders --chart-background so they match the card.
| Token | Default | Paints |
|---|---|---|
--chart-1 | your theme's | the first series |
--chart-2 | your theme's | the second series |
--chart-3 | your theme's | the third series |
--chart-background | --card | dot halos, the gaps between stacked marks |
--chart-graticule | --chart-grid | a map's lines of longitude and latitude |
--chart-tooltip-background | --popover | the tooltip panel |
:root {
  --chart-background: var(--background);
  --chart-tooltip-background: var(--card);
}
Accessibility
The map is announced as an image named by ariaLabel ("Bubble map" by default). Name the measure and the period there, and the biggest places in ariaDescription.
The land never takes focus. Arrow keys move through the bubbles from left to right across the map, each showing its tooltip.
- Tab
- Moves focus to the map, on its leftmost bubble.
- Arrow Right
- Moves to the next bubble to the right. ArrowDown does the same.
- Arrow Left
- Moves to the previous bubble. ArrowUp does the same.
- Home
- Jumps to the leftmost bubble.
- End
- Jumps to the rightmost bubble.
API reference
Vue takes the same props as React, in camelCase or kebab-case, with class for className. Render props are scoped slots (#content), and callbacks such as onHoverChange can be written as listeners (@hover-change).
BubbleMapChart
datareadonly SpatialRow[]
The places: one row per bubble, with a longitude, a latitude and a value.
geography?FeatureCollection<Geometry, Readonly<Record<string, unknown>> | null>
The countries to draw under the bubbles (GeoJSON; BubbleMapLand styles them), such as the kit's worldCountries.
- Type
FeatureCollection<Geometry, Readonly<Record<string, unknown>> | null>
longitudeKey?string
Key of each row's longitude, in degrees.
- Default
"longitude"
latitudeKey?string
Key of each row's latitude, in degrees.
- Default
"latitude"
nameKey?string
Key of each row's name, the tooltip's title.
- Default
"name"
projection?SpatialProjection
The map projection.
- Default
"equal-earth"
rotate?readonly [number, number]
Rotation of the projection, [longitude, latitude] in degrees: [-10, 0] centers 10° east.
fit?"sphere" | "geography" | "data"
What fills the plot: the whole world, the geography's features (a region), or the places in data (with room for the bubbles).
- Type
"sphere" | "geography" | "data"- Default
"sphere"
aspectRatio?string
Aspect ratio of the chart as "width / height".
- Default
"2 / 1"
margin?Partial<SpatialMargin>
Space around the plot in pixels. Any side you omit keeps its default.
- Type
Partial<SpatialMargin>
animate?boolean
Play the entrance animation.
- Default
true
animationDuration?number
Length of the entrance sweep in milliseconds: the time from the first mark starting to the last one.
- Default
900
revealSignature?string
Changing this value replays the entrance animation.
status?ChartStatus
"loading" draws a pulsing skeleton of the chart's shape in place of its marks (the axes, grid and land stay) and ignores the pointer; switching to "ready" plays the entrance.
- Default
"ready"
loadingLabel?string
Text shown centered over the chart, with a shimmer, while status is "loading". Nothing is shown when it is unset or empty.
class?string
Additional class name for the chart container.
children?ReactNode
The chart's carriers: its layers, axes, grid, tooltip and legend.
ariaLabel?string
Accessible label of the chart.
ariaDescription?string
Longer accessible description of the chart.
BubbleMapBubbles
dataKeystring
Key of each row's value: the bubble's area.
maxRadius?number
Radius of the largest bubble, in pixels.
- Default
22
minRadius?number
Radius of the smallest, in pixels.
- Default
2
colorKey?string
Key of each row's category: each category takes the palette in order of appearance (--chart-1, --chart-2…).
color?string
The bubbles' fill without colorKey.
fillOpacity?number
Opacity of the bubbles' fill.
- Default
0.65
stroke?string
Color of the bubbles' outline.
- Default
"var(--chart-background)"
fadeOnHover?boolean
Dim the layer's other marks while one is hovered or focused.
- Default
true
inactiveOpacity?number
Opacity of the other marks while one is hovered or focused.
- Default
0.35
BubbleMapLand
fill?string
Fill of the land.
- Default
"var(--muted)"
stroke?string
Color of the borders between countries.
- Default
"var(--chart-background)"
strokeWidth?number
Width of the borders, in pixels.
- Default
0.5
BubbleMapGraticule
outline?boolean
Draw the world's outline too.
- Default
true
step?readonly [number, number]
Degrees between the lines, [longitude, latitude].
- Default
[20, 20]
stroke?string
Color of the lines.
- Default
"var(--chart-graticule)"
strokeWidth?number
Width of the lines, in pixels.
- Default
0.5
BubbleMapTooltip
#content?slot: { bubble, index }
Custom tooltip content. Replaces the default title and rows, inside the same panel.
formatValue?(value: number) => string
Formats the value row of the default content.
- Type
(value: number) => string- Default
the number with thousands separators
valueLabel?string
The label of the value row of the default content.
class?string
Additional class name for the tooltip panel.
panelStyle?CSSProperties
Inline styles merged onto the tooltip panel.
backgroundColor?string
Background color of the tooltip panel. Overrides the theme's popover color.
BubbleMapLegend
title?string
A title before the legend's items.
formatValue?(value: number) => string
Formats the values the legend shows.
- Type
(value: number) => string- Default
the number, thousands abbreviated (`2k`)
align?"start" | "center" | "end"
Where the legend sits in the row under the plot.
- Type
"start" | "center" | "end"- Default
"center"
class?string
Additional class name for the legend.
Examples
4 examples on Vue, each live with its code and its own install command.