shadcn.io is an independent project built on shadcn/ui
Installation
Overview
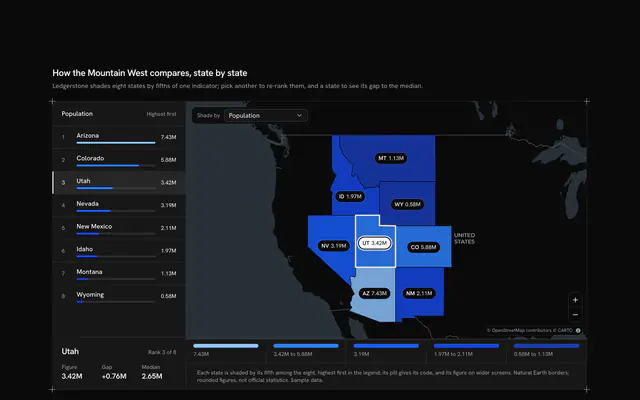
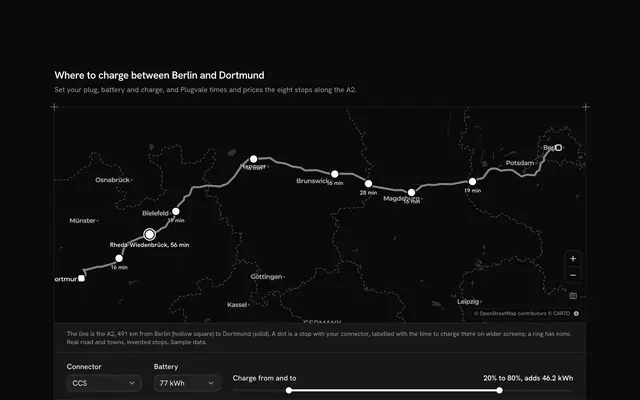
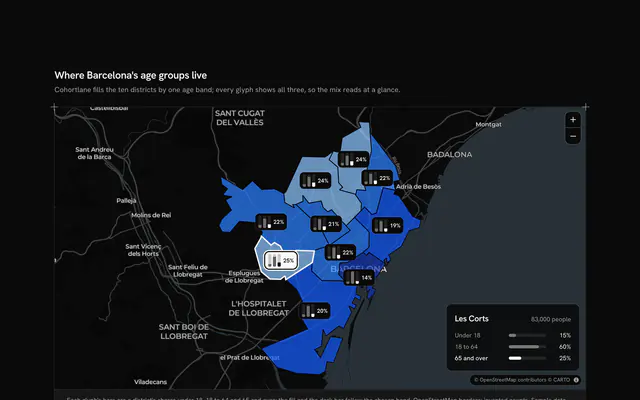
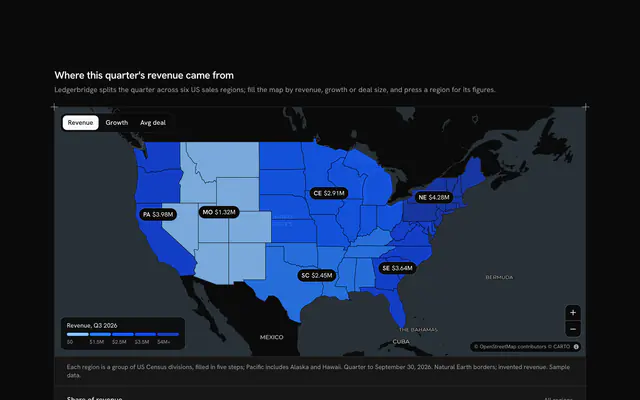
Show two figures on one map and let readers see where they agree, with this bivariate choropleth map for React with Ark UI. Plugfield, an EV charging planner, fills the 50 states and DC on a live Map by two measures at once: the share of new cars sold that are electric, and the public charge points per 100,000 people. Each measure is cut into thirds from the data, and the nine pairs of thirds make a 3 × 3 key under the map: the hue deepens from left to right with the EV share, and the tone moves toward the text colour from bottom to top with the charge points, so the colours follow your theme, light or dark. Hover a state, or click it, and the card over the map reads its two figures and the third each falls in. Press a square of the key to light its states, fade the rest and list them as buttons; with nothing lit, the four corners (Early, Charger gap, Built ahead, Mature) stand in. A cell beside the key gives the rank correlation of the two measures, worked out from the data. Built from Map, Button and Guides. For policy dashboards, market research, public health maps and any atlas that compares two rates.
FAQ
How is a state's colour chosen?
Each measure is sorted and cut at a third and two thirds of the way up, so each third holds about 17 states (a tie at a cut can tip one over). A state's cell is its EV third across and its charge points third up. The colour mixes the theme's middle chart colour into the background for the EV third (a hint, a little over half, all of it), then mixes in the text colour for the charge points third (none, a quarter, half). The nine colours stay apart in every preset, light and dark, and the key shows each with its count.
Where do the figures come from, and what stays local?
The state borders are Natural Earth's, loaded from a pinned file on jsDelivr; the map's tiles come from CARTO over OpenStreetMap data. The 51 pairs of figures are typed into LINES at the top of the file and invented for this demo, as is Plugfield. Nothing you hover or press is sent or saved.
What does the rank correlation say?
It is Spearman's rank correlation of the two measures over the 51 places, ties sharing a rank, computed when the module loads. Near 1, the two rise together; near 0, they don't track each other. The count beside it is how many states sit on the key's diagonal, in the same third on both measures; the corners off it, such as Charger gap and Built ahead, are where they part.
Can I use it without a mouse?
Yes. Every square of the key is a button that says its name, its count and its two ranges; pressing it lights its states and lists them as buttons, and pressing one fills the card with that state's figures. With nothing lit, the four corners are buttons too. The map takes the arrow keys and plus and minus once focused, and a polite message says what changed.