shadcn.io is an independent project built on shadcn/ui
Installation
Overview
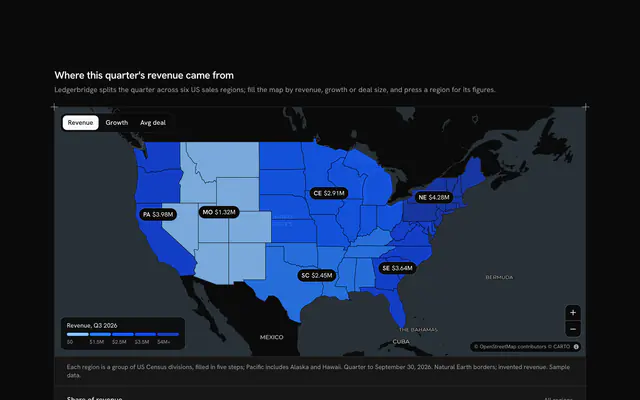
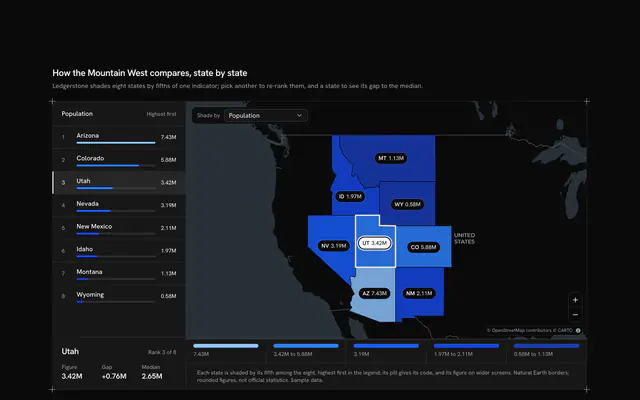
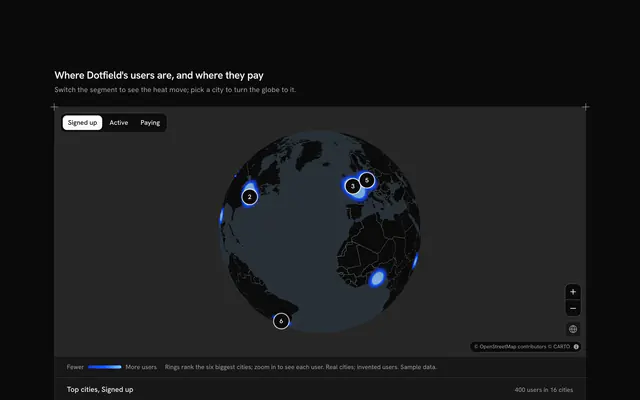
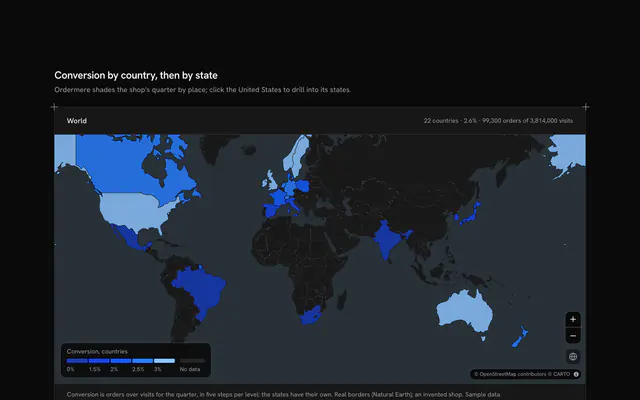
Read a map and a chart as one, with this linked chart map for React with Ark UI. Teamloft, a team workspace, counts its paying teams in the twelve countries of South America: a live Map that follows your theme, light or dark, shades each country with Natural Earth's borders in five steps of the theme's chart ramp, and beside it a horizontal bar chart ranks the same countries in the same shades, on an axis with gridlines at fifths. The two are linked both ways. Hovering or focusing a bar lights its country with a heavy outline while the others fade; hovering a country lights its bar the same way, and a readout over the map names it with its figure and rank ("Chile: 1,310 teams, 4th of 12"). Pressing a bar or a country, or tapping it on a phone, pins it so the link holds without a pointer, and pressing it again lets go. A Toggle Group switches the figure between teams and teams per million people: the bars re-rank (Uruguay jumps from seventh to first), the map re-shades and its legend follows. Built from Map, Toggle Group and Guides. For analytics dashboards, sales and growth reports, public data and any figure that belongs to a place.
FAQ
How are the map and the chart linked?
Both sides write to the same two pieces of state: the country under the pointer or the keyboard focus, and the pinned one. The lit country is the first if there is one, else the second. The chart dims every other bar and greys its name; the map gets the lit country's code in its paint expressions, so its fill stays strong, its border turns heavy and the rest fade to a third. Nothing is computed twice: the same figureOf and stepOf give the bar's length and shade and the country's fill.
How are the five shades chosen?
Each figure has its own breaks in METRICS: 0, 100, 300, 1,000 and 2,000 teams, or 0, 20, 30, 45 and 60 teams per million people. A country takes the shade of the highest break its value reaches along the chart ramp, and the legend over the map spells out each range. On a light theme more is darker; on a dark theme the ramp turns round and more is lighter, so the biggest figures still stand out on the dark map. The bars use the very same shades, so a country and its bar always match.
Where does the data come from, and what stays local?
The borders are Natural Earth's 1:110m countries, the one file the block loads besides the map's tiles; the populations are rounded figures typed into LINES. Teamloft and its team counts are invented. Pointing, pinning and switching the figure only change what this page shows; nothing is sent.
Can I use it without a mouse?
Yes. Every bar is a button: tabbing onto one lights its country just as hovering does, and Enter or Space pins it. The figure toggle is a toggle group, the zoom buttons and the map itself (arrow keys, plus and minus) work from the keyboard too, and a polite message reads the pinned country's figure and rank, or the total. Every value on the map is also in the chart, so nothing is reachable by pointer alone.
Why do the rows stay put when the figure changes?
The rows are keyed by rank, not by country: switching to teams per million people rewrites each row in place with the country now at that rank, and the bars grow or shrink to their new length. The chart keeps its height and its place on the page, and the bars animate only where reduced motion allows.
How does it look on a phone?
The map comes first with its readout over it, then the chart under it. There is no hover on a touch screen, so a tap pins a country, on the map or in the chart, and the readout and the line under the chart say which. The legend leaves the map for a row under it, so it never covers a country.