shadcn.io is an independent project built on shadcn/ui
Installation
The command adds the example above to components/charts/ and, the first time, the chart kit to components/ui/charts/. Both are source files in your project from then on: read them, change them, delete what you don't use.
Usage
data holds two lists. places each have an id, a longitude and a latitude, and routes name two places by from and to, with an optional value. A route to a missing place is skipped.
import { worldCountries } from "@/components/charts/data/world-countries";
import {
  RouteMapChart,
  RouteMapLand,
  RouteMapPlaces,
  RouteMapRoutes,
  RouteMapTooltip,
} from "@/components/ui/charts";

const network = {
  places: [
    { id: "LHR", latitude: 51.47, longitude: -0.45, name: "London" },
    { id: "JFK", latitude: 40.64, longitude: -73.78, name: "New York" },
    { id: "DXB", latitude: 25.25, longitude: 55.36, name: "Dubai" },
    { id: "SIN", latitude: 1.36, longitude: 103.99, name: "Singapore" },
  ],
  routes: [
    { from: "LHR", to: "JFK", value: 9800 },
    { from: "LHR", to: "DXB", value: 7200 },
    { from: "DXB", to: "SIN", value: 5200 },
  ],
};

export const HubRoutes = () => (
  <RouteMapChart
    ariaLabel="Daily passengers on our hub routes"
    data={network}
    geography={worldCountries}
  >
    <RouteMapLand />
    <RouteMapRoutes />
    <RouteMapPlaces />
    <RouteMapTooltip valueLabel="Passengers a day" />
  </RouteMapChart>
);
Anatomy
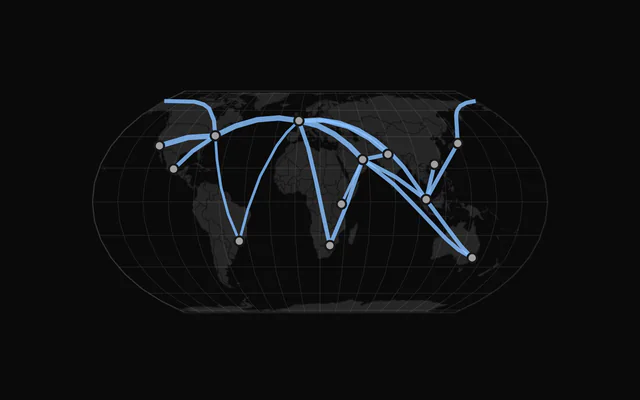
The layers stack in a fixed order: the world's outline, the land, the graticule, the routes, then the places on top.
<RouteMapChart data={network} geography={worldCountries}>
  <RouteMapGraticule />
  <RouteMapLand />
  <RouteMapRoutes />
  <RouteMapPlaces />
  <RouteMapTooltip valueLabel="Passengers" />
</RouteMapChart>RouteMapChart: Holds the places, the routes and the projection every layer shares.RouteMapGraticule: Lines of longitude and latitude, and the world's outline.RouteMapLand: The countries fromgeography.RouteMapRoutes: Each route as a great circle, wider the higher itsvalue.RouteMapPlaces: A dot on each place.RouteMapTooltip: A route's two ends and value, or a place's name and how many routes touch it.RouteMapLegend: The route categories and their colors. It needscolorKey.
Routes and widths
Each route follows the shortest path over the globe between its two places, so long routes bow toward the poles on a flat map.
Its value sets the width, from 1 to 4 px by default (widthRange). Widths come in four steps on a square-root scale, not a smooth range, so routes of similar weight look the same. A route without a value is drawn at the thinnest.
Hovering routes
Thin lines are hard to hit, so the pointer doesn't have to land on one: the nearest route within 6 px is picked, and a place under the pointer wins over any route. The others dim to inactiveOpacity (0.25).
Regions and colors
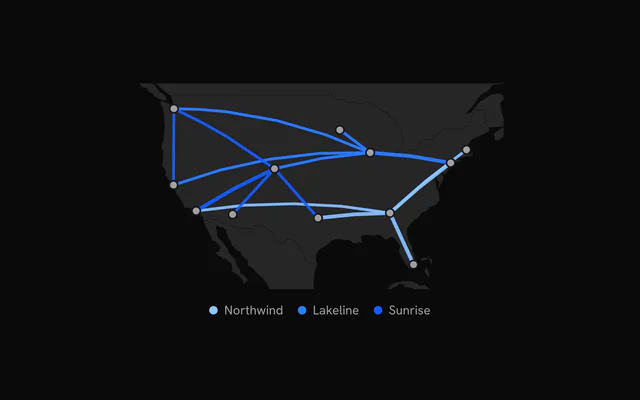
Set fit="data" to fit the map to your places instead of the whole world, and projection="mercator" for a familiar regional view. Countries past the edge are clipped.
colorKey on <RouteMapRoutes> gives each value of a route's field its own chart color, in order of appearance, and <RouteMapLegend /> names them under the map.
Customization
The kit is in your project, in components/ui/charts/: your framework's components over a shared core/. Change a default there and every chart picks it up.
className goes on the chart's container, so size and spacing are utility classes.
content on <RouteMapTooltip> gets either a route or a place, with the other one null, so one function covers both. Any extra field on a route, such as a flight number or a carrier, is there to show.
<RouteMapPlaces> takes radius and color for the dots, and <RouteMapLand> the countries' fill, stroke and strokeWidth.
<RouteMapTooltip
  content={({ place, route }) => (
    <div className="px-3 py-2 text-sm">
      {route ? `${route.from} to ${route.to}` : place?.name}
    </div>
  )}
/>
Where a part renders content of its own, you pass it in. In React:
RouteMapTooltip:content={({ route, place, index }) => …}
Loading state
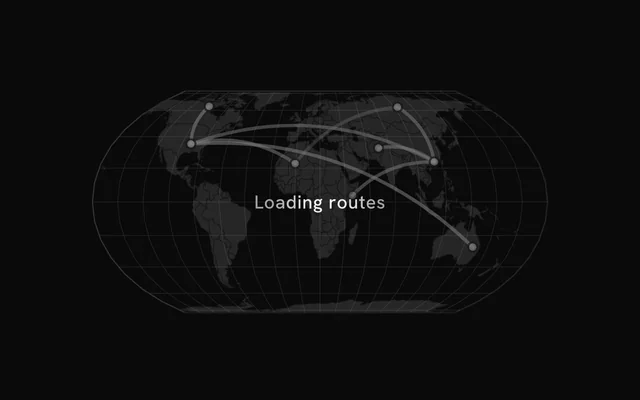
With status="loading" the land stays, and skeleton arcs shimmer between a few dots on it. The pointer is ignored until "ready", when the skeleton fades and the real routes trace in.
loadingLabel puts a short line of text over the map.
Animation
The land fades in, the routes trace themselves from end to end, and the places pop in while the last ones are still drawing. animationDuration (900 ms) is how long each route takes to trace.
Change revealSignature to play it again. animate={false} and reduced motion both draw the map at rest.
Theming
Every color in the kit is one of your theme's tokens or a mix of them, except --chart-positive, a fixed green. A preset or the .dark class restyles the chart, and overriding a token in your CSS changes it everywhere.
Routes default to --chart-1, and with colorKey they take --chart-1 to --chart-5 in order. Places are --chart-foreground, the land --muted with --chart-background borders.
| Token | Default | Paints |
|---|---|---|
--chart-1 | your theme's | the first series |
--chart-2 | your theme's | the second series |
--chart-3 | your theme's | the third series |
--chart-background | --card | dot halos, the gaps between stacked marks |
--chart-graticule | --chart-grid | a map's lines of longitude and latitude |
--chart-tooltip-background | --popover | the tooltip panel |
:root {
  --chart-background: var(--background);
  --chart-tooltip-background: var(--card);
}
Accessibility
The map is announced as an image named by ariaLabel ("Route map" by default). Say what the routes carry and over what period, and name the busiest in ariaDescription.
Arrow keys move through the places and routes from left to right, a route counted at its midpoint. Each shows the tooltip it shows on hover.
- Tab
- Moves focus to the map, on its leftmost place or route.
- Arrow Right
- Moves to the next one to the right. ArrowDown does the same.
- Arrow Left
- Moves to the previous one. ArrowUp does the same.
- Home
- Jumps to the leftmost place or route.
- End
- Jumps to the rightmost place or route.
API reference
RouteMapChart
dataRouteMapData
The places and the routes between them. A route naming a place that isn't there is left out.
geography?FeatureCollection<Geometry, Readonly<Record<string, unknown>> | null>
The countries to draw under the routes (GeoJSON; RouteMapLand styles them), such as the kit's worldCountries.
- Type
FeatureCollection<Geometry, Readonly<Record<string, unknown>> | null>
projection?SpatialProjection
The map projection.
- Default
"equal-earth"
rotate?readonly [number, number]
Rotation of the projection, [longitude, latitude] in degrees.
fit?"sphere" | "geography" | "data"
What fills the plot: the whole world, the geography's features, or the places (a region's routes).
- Type
"sphere" | "geography" | "data"- Default
"sphere"
aspectRatio?string
Aspect ratio of the chart as "width / height".
- Default
"2 / 1"
margin?Partial<SpatialMargin>
Space around the plot in pixels. Any side you omit keeps its default.
- Type
Partial<SpatialMargin>
animate?boolean
Play the entrance animation.
- Default
true
animationDuration?number
Length of the entrance sweep in milliseconds: the time from the first mark starting to the last one.
- Default
900
revealSignature?string
Changing this value replays the entrance animation.
status?ChartStatus
"loading" draws a pulsing skeleton of the chart's shape in place of its marks (the axes, grid and land stay) and ignores the pointer; switching to "ready" plays the entrance.
- Default
"ready"
loadingLabel?string
Text shown centered over the chart, with a shimmer, while status is "loading". Nothing is shown when it is unset or empty.
className?string
Additional class name for the chart container.
children?ReactNode
The chart's carriers: its layers, axes, grid, tooltip and legend.
ariaLabel?string
Accessible label of the chart.
ariaDescription?string
Longer accessible description of the chart.
RouteMapRoutes
color?string
Color of the routes.
- Default
"var(--chart-1)"
colorKey?string
Key of each route's category: each category takes the palette in order of appearance (--chart-1, --chart-2…).
widthRange?readonly [number, number]
Width of the lightest and the heaviest route, in pixels (by value).
- Default
[1, 4]
opacity?number
Opacity of the routes at rest.
- Default
0.8
inactiveOpacity?number
Opacity of the other marks while one is hovered or focused.
- Default
0.25
fadeOnHover?boolean
Dim the layer's other marks while one is hovered or focused.
- Default
true
RouteMapPlaces
radius?number
Radius of the dots, in pixels.
- Default
3.5
color?string
Fill of the dots.
- Default
"var(--chart-foreground)"
RouteMapLand
fill?string
Fill of the land.
- Default
"var(--muted)"
stroke?string
Color of the borders between countries.
- Default
"var(--chart-background)"
strokeWidth?number
Width of the borders, in pixels.
- Default
0.5
RouteMapGraticule
outline?boolean
Draw the world's outline too.
- Default
true
step?readonly [number, number]
Degrees between the lines, [longitude, latitude].
- Default
[20, 20]
stroke?string
Color of the lines.
- Default
"var(--chart-graticule)"
strokeWidth?number
Width of the lines, in pixels.
- Default
0.5
RouteMapTooltip
content?(args: RouteMapTooltipArgs) => ReactNode
Custom tooltip content. Replaces the default title and rows, inside the same panel.
- Type
(args: RouteMapTooltipArgs) => ReactNode
formatValue?(value: number) => string
Formats the value row of the default content.
- Type
(value: number) => string- Default
the number with thousands separators
valueLabel?string
The label of the value row of the default content.
className?string
Additional class name for the tooltip panel.
panelStyle?CSSProperties
Inline styles merged onto the tooltip panel.
backgroundColor?string
Background color of the tooltip panel. Overrides the theme's popover color.
RouteMapLegend
title?string
A title before the legend's items.
formatValue?(value: number) => string
Formats the values the legend shows.
- Type
(value: number) => string- Default
the number, thousands abbreviated (`2k`)
align?"start" | "center" | "end"
Where the legend sits in the row under the plot.
- Type
"start" | "center" | "end"- Default
"center"
className?string
Additional class name for the legend.
Examples
3 examples on React, each live with its code and its own install command.