Composed Chart Examples
11 composed charts: grouped and stacked bars, target and trend lines, separate scales, price over volume and profit and loss. Each on React, Vue, Svelte and Solid, drawn with TanStack Charts in your theme. Composed chart docs and API.
Every composed chart example
11 examples.
- Composed ChartComposed chartUnits sold as bars, revenue as a line and the run rate as a soft area behind them.
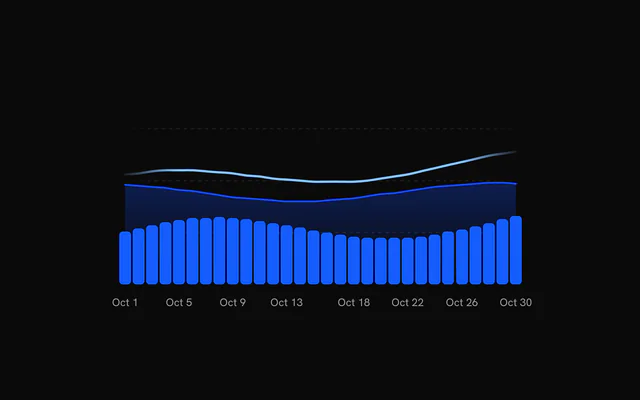
- Composed Chart with a Target LineComposed chartWeekly revenue bars against a steadily rising target line, with a four-week trend area behind.
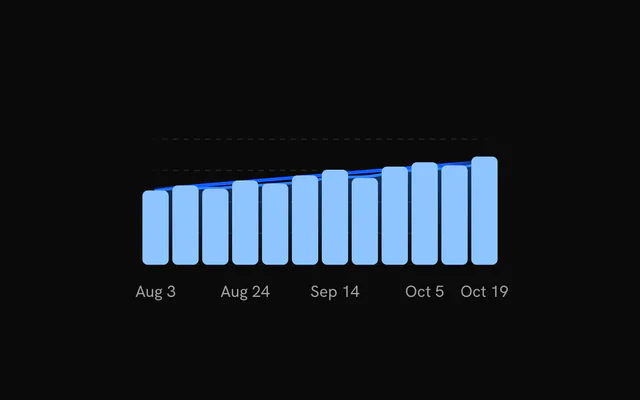
- Composed Chart with Grouped BarsComposed chartSignups and activations side by side each week, under a goal line.
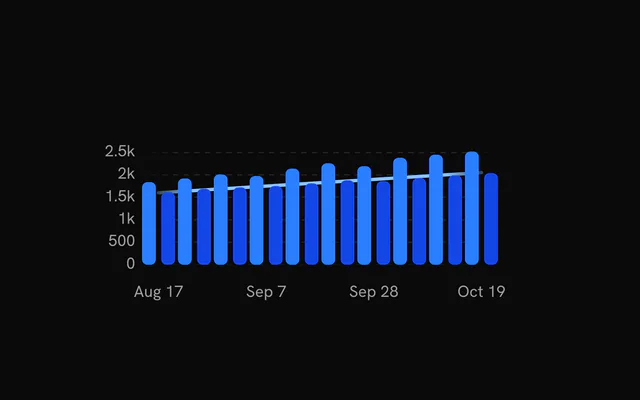
- Composed Chart with Stacked BarsComposed chartOrganic and paid stacked into one column per day, with a 2 px gap between them.
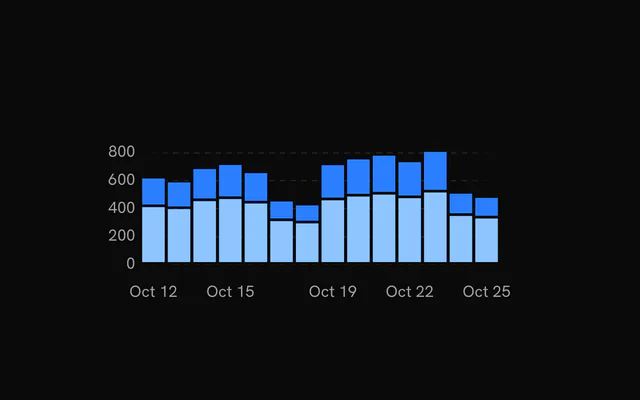
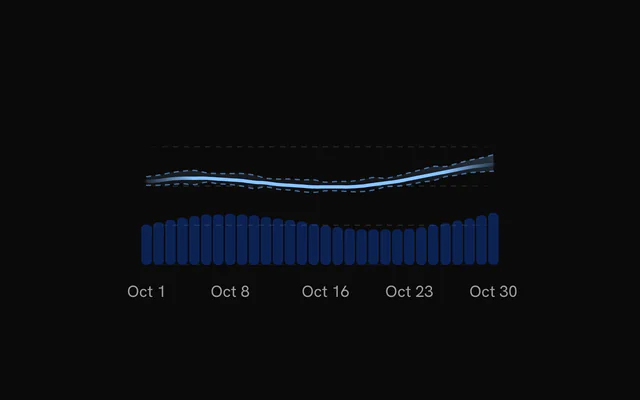
- Composed Chart with an Expected RangeComposed chartRevenue runs inside its forecast's low-to-high band, drawn dashed with a gradient, over faint unit bars.
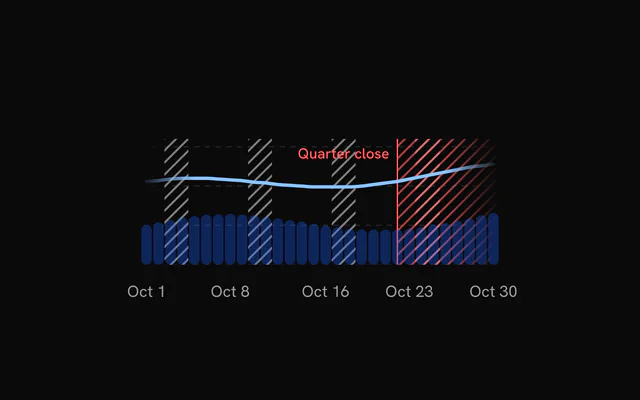
- Composed Chart with Date HighlightsComposed chartWeekends striped behind the bars, and a labeled line where the quarter closes.
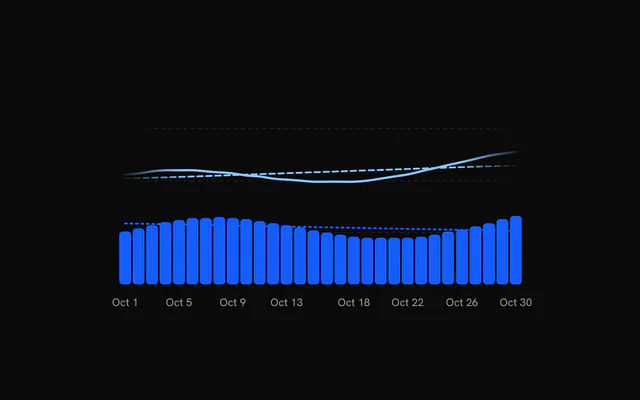
- Composed Chart with Trend LinesComposed chartOne trend line per series, faded at the ends for revenue and dotted for units.
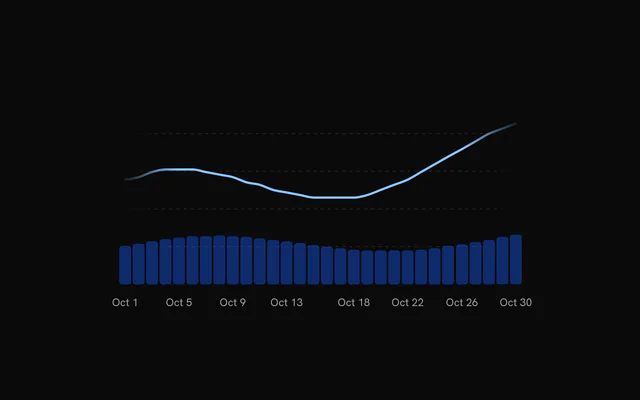
- Composed Chart with Separate ScalesComposed chartBars kept to the bottom third and the line lifted above them, both placed with `yDomains`.
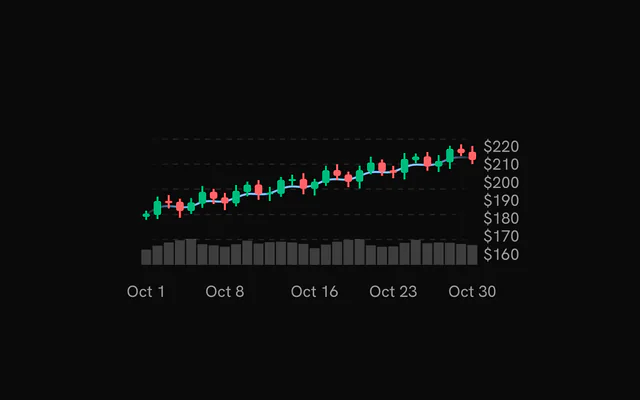
- Composed Chart with Price and VolumeComposed chartCandles and a five-day average on a floating price axis, volume as quiet bars underneath.
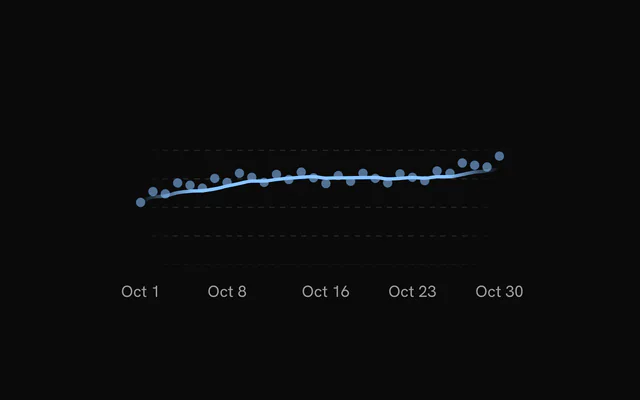
- Composed Chart with a Moving AverageComposed chartEach day's signups as a faint dot, with the seven-day average drawn through them.
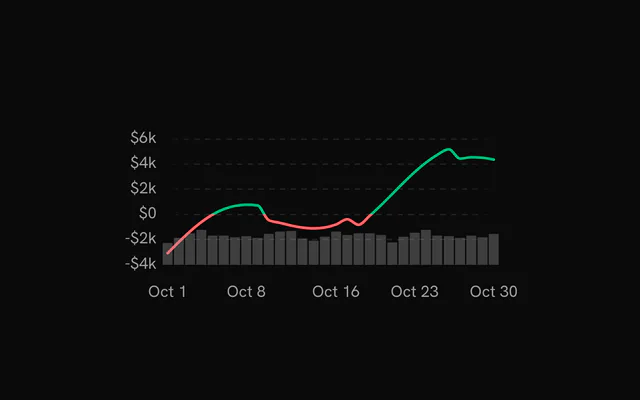
- Composed Chart with Profit and LossComposed chartThe running total turns green above zero and red below, over each day's trade count.
Or describe it. With Pro, your AI agent installs the composed chart example you describe, on your framework.
Get ProGalleries
More chart examples
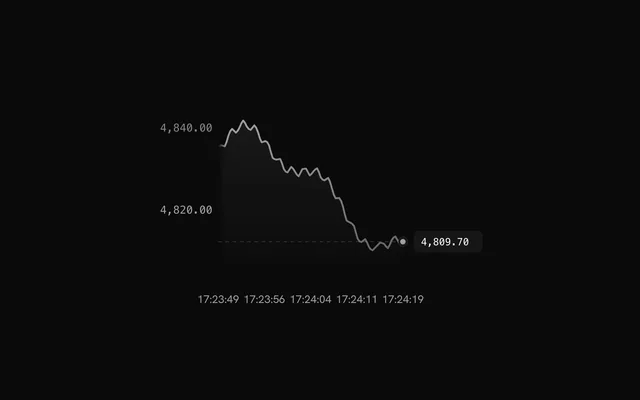
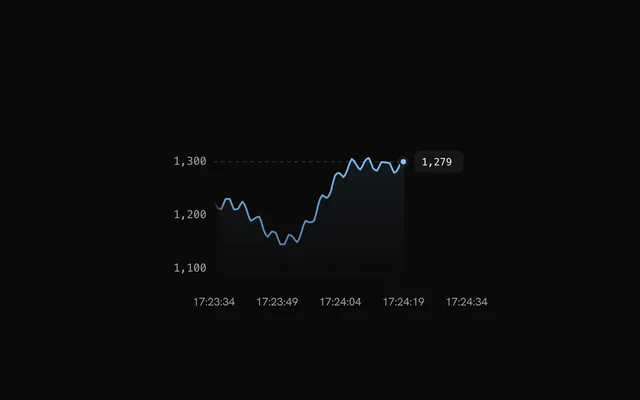
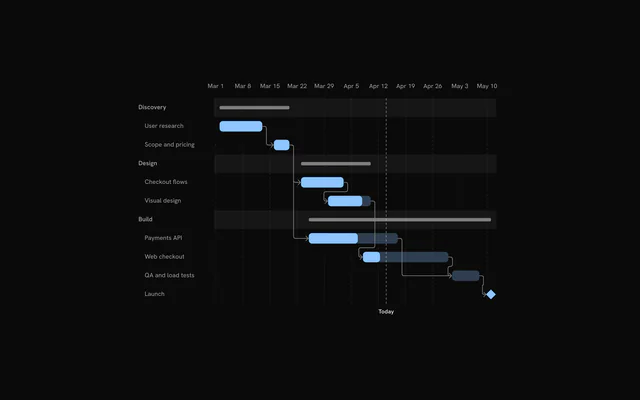
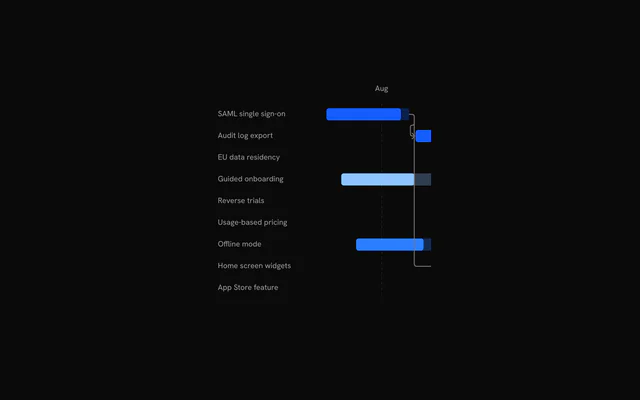
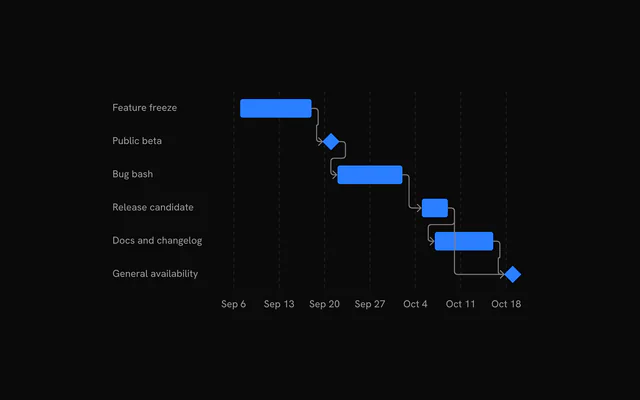
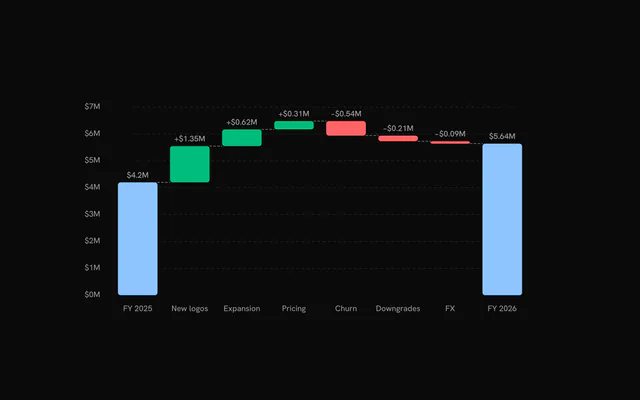
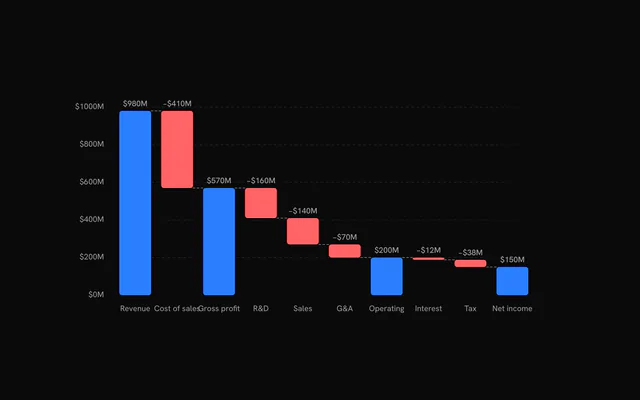
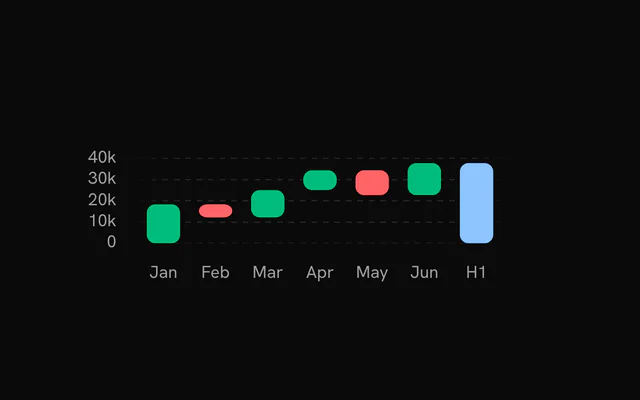
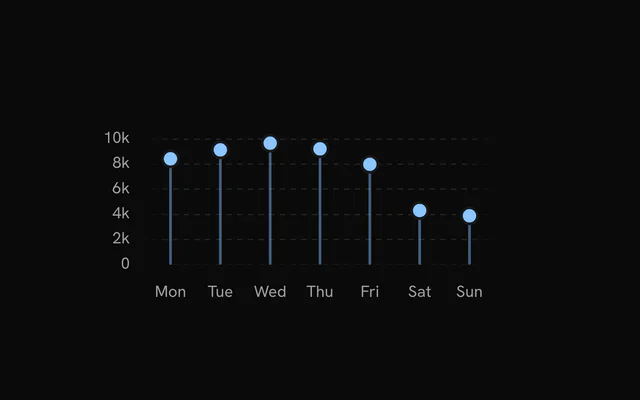
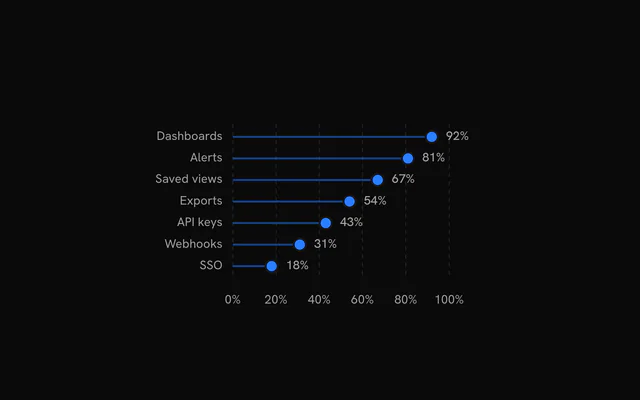
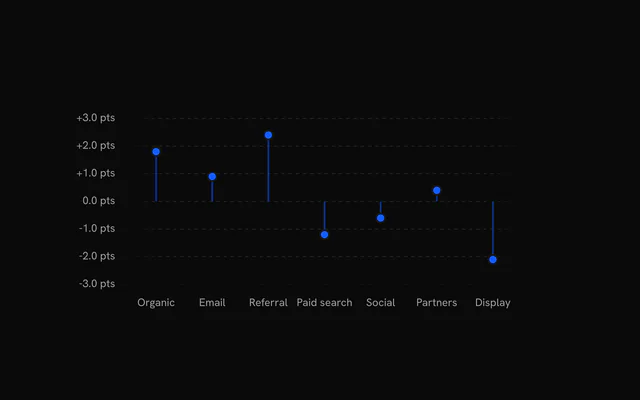
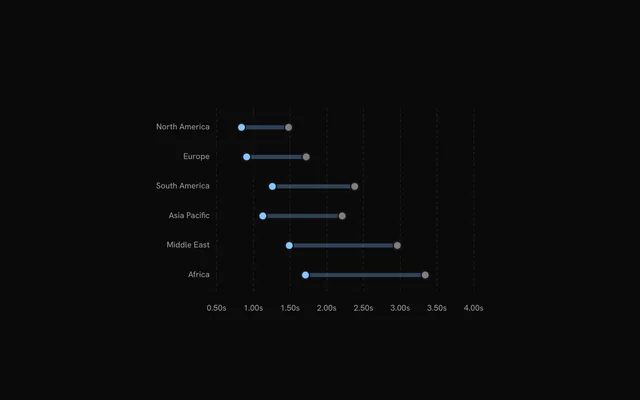
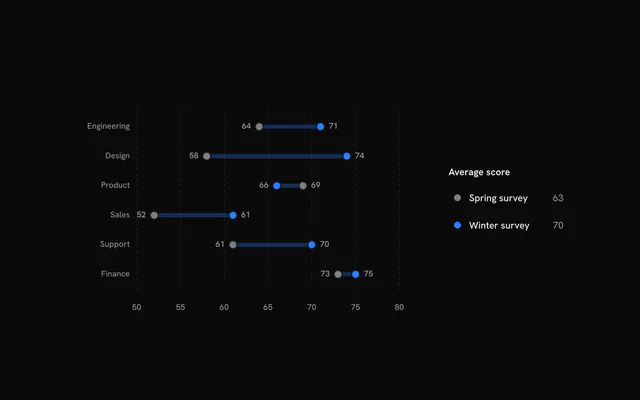
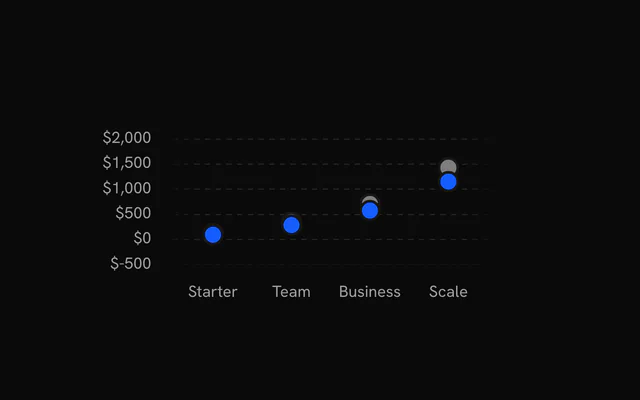
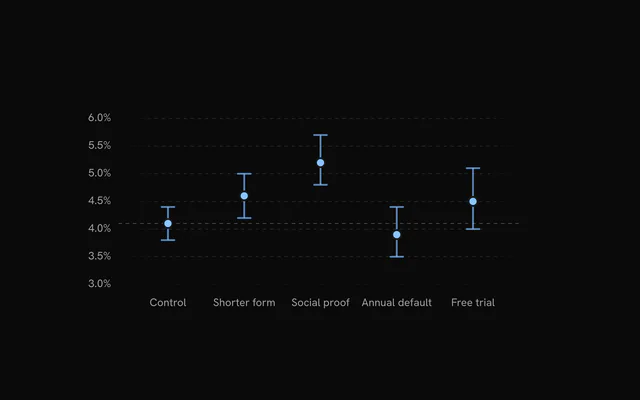
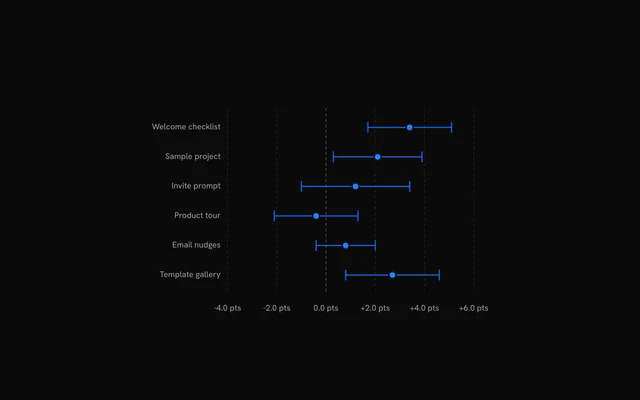
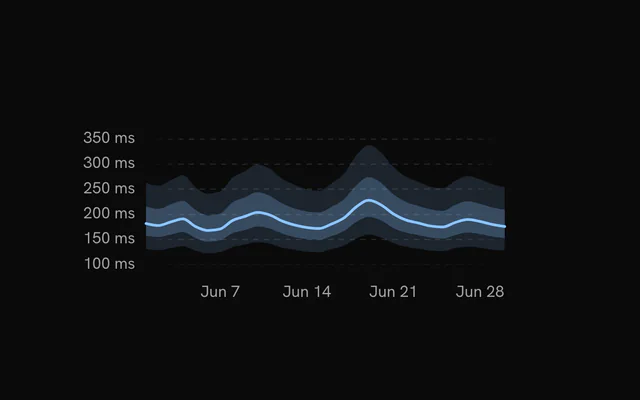
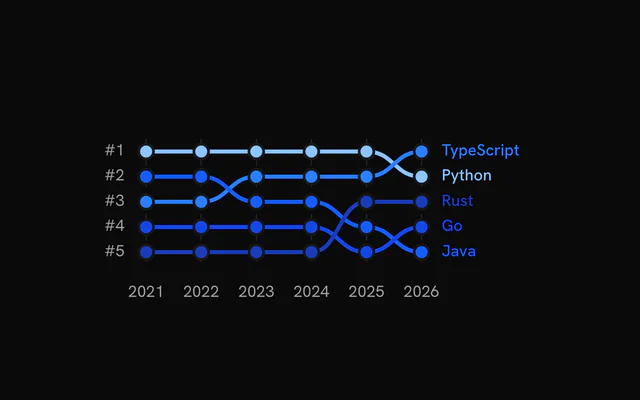
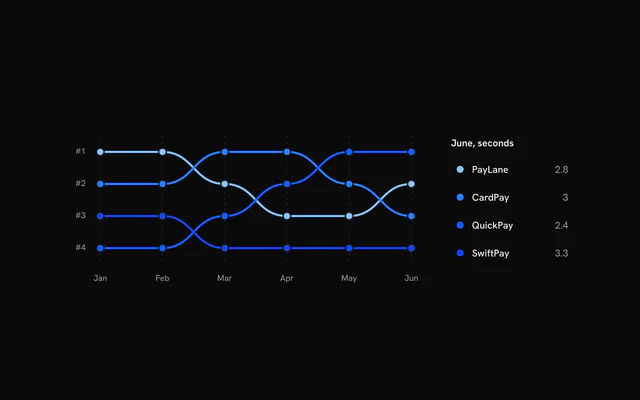
8 more chart types, free: open one for its examples and their code.
Pricing
Composed Chart examples MCP, with Pro
Your AI agent installs any of the 1434 examples, and every component, block and icon, with every Pro plan.
4.9/5 out of 5 · 150+ reviewsfrom 150+ founders and developers.
- Secure checkout via Stripe
- Code lives in your repo
- Keep what you've shipped if you cancel
- License terms
FAQ
Frequently asked questions
11: Composed Chart, Composed Chart with a Target Line, Composed Chart with Grouped Bars, Composed Chart with Stacked Bars, Composed Chart with an Expected Range, Composed Chart with Date Highlights, Composed Chart with Trend Lines, Composed Chart with Separate Scales, Composed Chart with Price and Volume, Composed Chart with a Moving Average and Composed Chart with Profit and Loss. Each page has the live chart, its code and a one-line install.
Signed in, copy the chart's command: `npx shadcn@latest add` with its URL. It adds the chart to `components/charts`, the `chart-kit` kit every chart imports, and `@tanstack/charts`. Import the chart and render it.
Yes. Every chart is free to use in personal and commercial projects. Seeing the code and installing it takes a free account, one tap with Google or GitHub. Pro is the site's paid plan for blocks, the Pro collections and the MCP, and the charts don't need it.
4.9 out of 5 from 150+ developers


Every composed chart example. One prompt away.
Every composed chart example is free with an account. With Pro, your AI agent installs them from a prompt.
Get Pro