Linked Chart
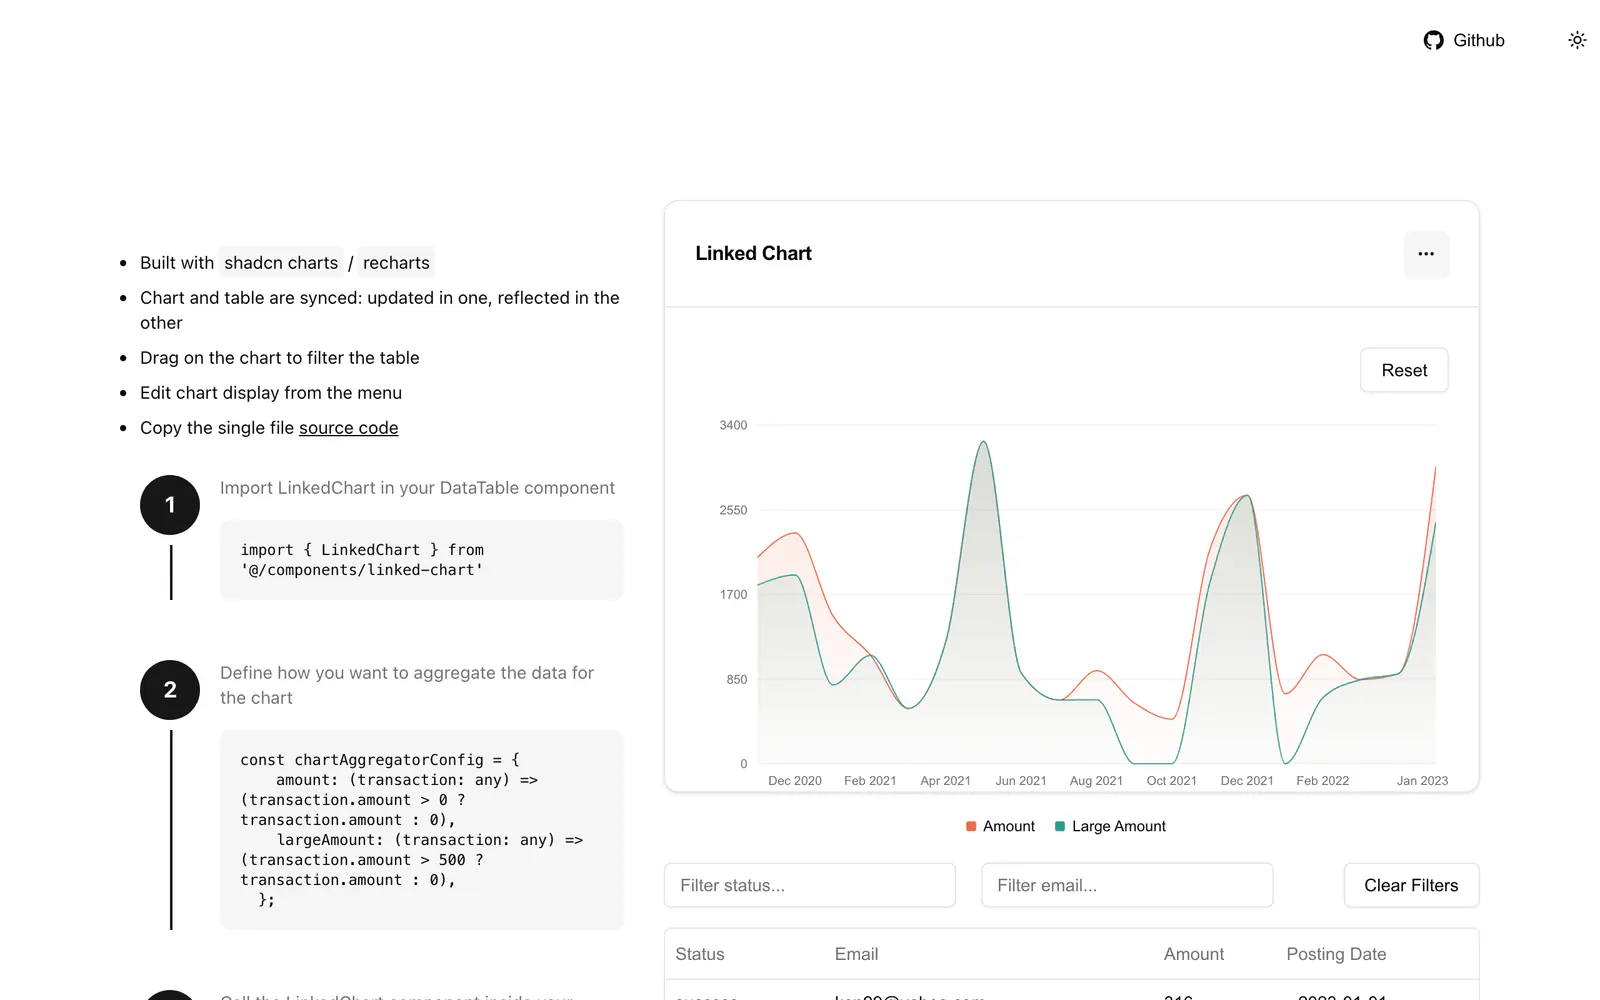
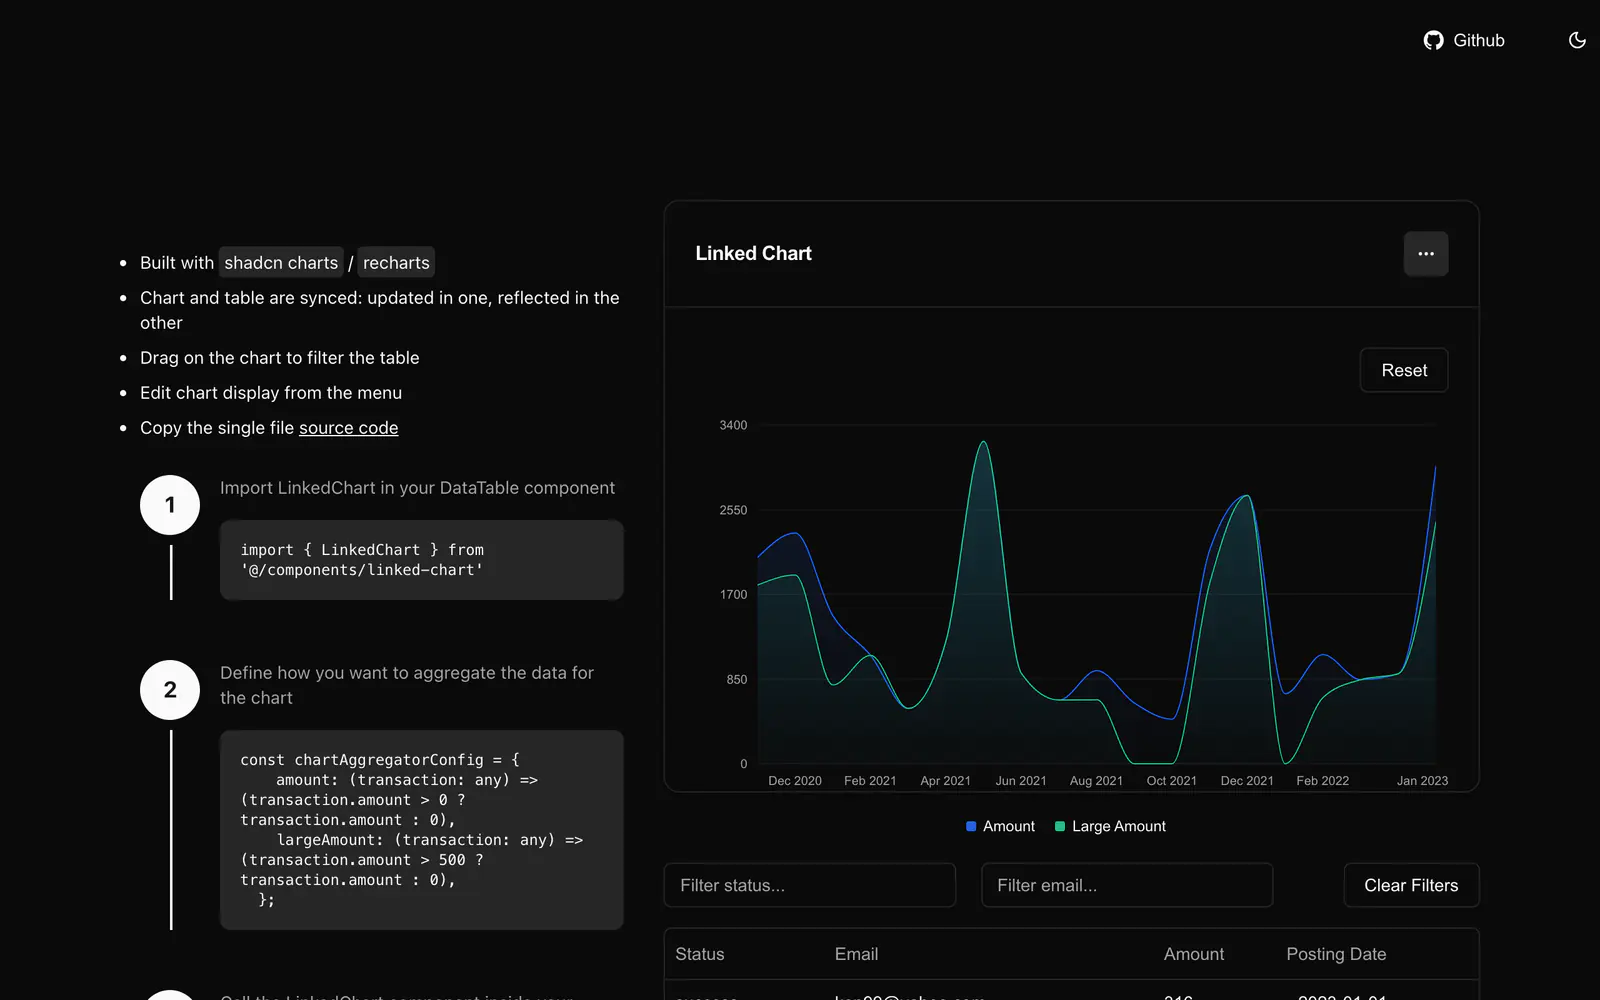
A chart component that stays in sync with a shadcn data table, so dragging on the chart filters rows.
- Category
- Libraries & Components
- Added
- GitHub stars
- 70
About
About Linked Chart
Linked Chart is a React component that links a chart and a data table. Changes in one are reflected in the other, and dragging across the chart filters the table rows. It is built on shadcn charts, which use Recharts, with TanStack Table for the table, inside a Next.js demo.
The README lists multiple date groupings, such as month, quarter and year, and area or bar charts. To use it, copy the single linked-chart.tsx file, import LinkedChart in your DataTable component, define an aggregator config for the series and pass it the filtered row data and setColumnFilters. The repository states no license and was last pushed in May 2025. It builds on the zoom-chart-demo project.
Linked Chart features
6 features
- Chart and table kept in sync
- Drag on the chart to filter rows
- Area and bar chart types
- Month, quarter and year grouping
- Single-file source
- Aggregation config
What you can build with Linked Chart
3 use cases
- Exploring transactions by dragging over a date range
- Adding a summary chart above a data table
- Building a finance dashboard with linked filtering
Libraries & Components
Similar to Linked Chart
More libraries & components like Linked Chart: the closest by what they do, then the most starred.
 Shadcn Admin KitLibraryShadcn Admin Kit from Marmelab gives React apps CRUD pages, data tables, forms and auth hooks, on shadcn/ui, Base UI and TanStack Query.
 Crypto ChartsLibraryCrypto Charts is a Next.js demo that draws shadcn/ui charts with Recharts, using free historical crypto data from Pyth. No credentials needed.
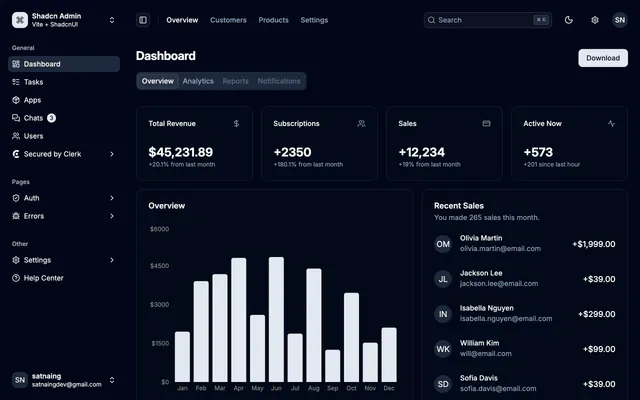
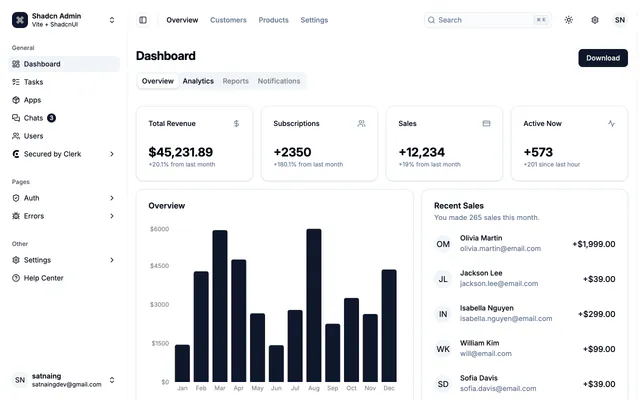 shadcn-adminLibraryshadcn-admin is an MIT-licensed admin dashboard UI for Vite and shadcn/ui, with stat cards, a monthly chart, tabs and a recent sales list ready to adapt.
 TremorLibraryTremor offers 35+ open-source, accessible React components for charts and dashboards, built on Recharts, Radix UI and Tailwind CSS. Copy and paste.
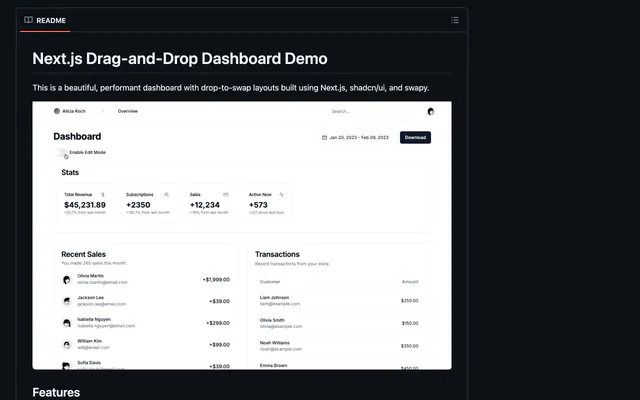
 dnd-dashboardLibrarydnd-dashboard is a Next.js demo with drop-to-swap layouts built on shadcn/ui and swapy. Clone it to see how drag-and-drop panels can be wired up.
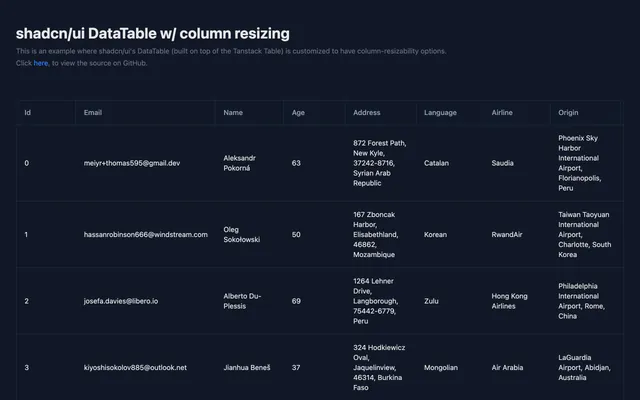
 Advanced Data TableLibraryAdvanced Data Table extends the shadcn/ui DataTable with draggable column widths, as a Vite, React and TypeScript example with source on GitHub.
Pricing
Ship it with Pro
The directory is free. Pro adds 6,000+ blocks, 14 premium templates and the MCP server, so your AI editor installs them for you.
4.9/5 out of 5 · 150+ reviewsfrom 150+ founders and developers.
- Secure checkout via Stripe
- Code lives in your repo
- Keep what you've shipped if you cancel
- License terms
FAQ
Frequently asked questions
What Linked Chart is, how to install it, its license and its alternatives.
shadcn charts built on Recharts, TanStack Table and Next.js.
A chart component that stays in sync with a shadcn data table, so dragging on the chart filters rows.
Linked Chart lists Chart and table kept in sync, Drag on the chart to filter rows, Area and bar chart types, Month, quarter and year grouping, Single-file source and Aggregation config.
The directory lists these uses for Linked Chart: Exploring transactions by dragging over a date range, Adding a summary chart above a data table and Building a finance dashboard with linked filtering.
Linked Chart is made by ardasisbot, at https://github.com/ardasisbot. Its site is https://github.com/ardasisbot/linked-chart.
Linked Chart was added to the directory on February 3, 2025.
Linked Chart is in Libraries & Components. Component libraries and standalone components built on shadcn/ui, covering the data tables, pickers, editors and charts the core set leaves out.
Charts, Data table, TanStack, Dashboard, Next.js, React, Copy and paste and Open source. Each tag has a page listing the other resources that carry it.
Yes. Linked Chart's page has a Live tab beside the screenshot that loads its site in a frame.
Copy components/linked-chart.tsx, import LinkedChart in your DataTable, define an aggregator config and pass it the rows, columns and setColumnFilters.
The directory lists no install command for Linked Chart. Follow the instructions on its site at https://github.com/ardasisbot/linked-chart.
The directory lists no shadcn CLI command for Linked Chart. Check its docs at https://github.com/ardasisbot/linked-chart for how to add it.
Linked Chart's repository is https://github.com/ardasisbot/linked-chart.
The directory links no separate docs for Linked Chart; start from its site at https://github.com/ardasisbot/linked-chart.
The directory records no license for Linked Chart. Check its repository or site before you use it.
The directory records no price for Linked Chart. Its site, https://github.com/ardasisbot/linked-chart, is where its pricing, if any, is stated.
No. Linked Chart is made by ardasisbot and listed here as a link. A shadcn.io Pro plan covers shadcn.io's own blocks, templates and tools.
Other resources in Libraries & Components, newest first: Shadcn Admin Kit, Crypto Charts, shadcn-admin and Tremor. Their pages are linked under Similar to Linked Chart.
Open its category, Libraries & Components, or one of its tags (Charts, Data table and TanStack): each page lists the resources that share it.
4.9 out of 5 from 150+ developers


Found your stack? Ship it.
6,000+ blocks, premium templates and MCP in every Pro plan. The directory stays free.
Get Pro