#charts
19 resources tagged Charts in Awesome shadcn/ui.
#charts
19 resources
19 shadcn/ui resources for charts: libraries, registries, templates and tools. Each with a screenshot, a write-up and its links.
19 resources.
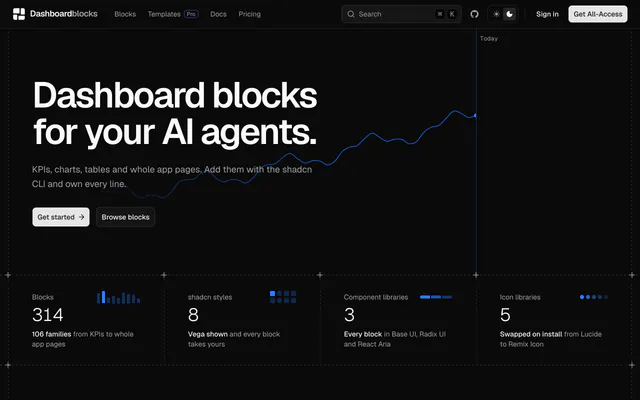
 DashboardblocksRegistryDashboardblocks offers 314 open-source dashboard blocks for shadcn/ui, from KPI cards to full pages, for Radix UI, Base UI and React Aria.
 SaaS Dashboard StarterTemplateSaaS Dashboard Starter from StudioGrid Pro is an MIT dashboard template: Next.js 16, React 19, Tailwind CSS 4, shadcn/ui on Base UI and Recharts.
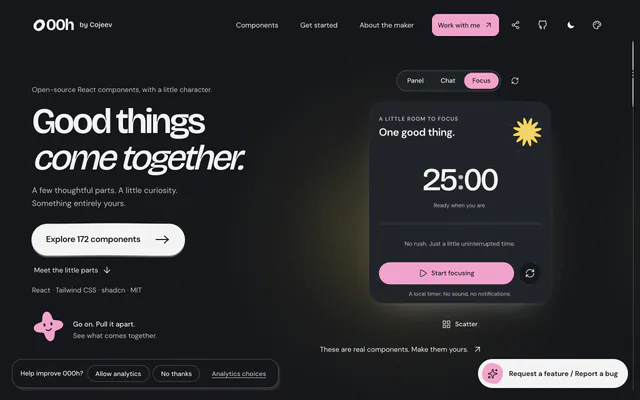
 000hRegistry000h is an MIT-licensed shadcn registry of 172 React components with organic shapes and motion, covering charts, drawers and WebGL art.
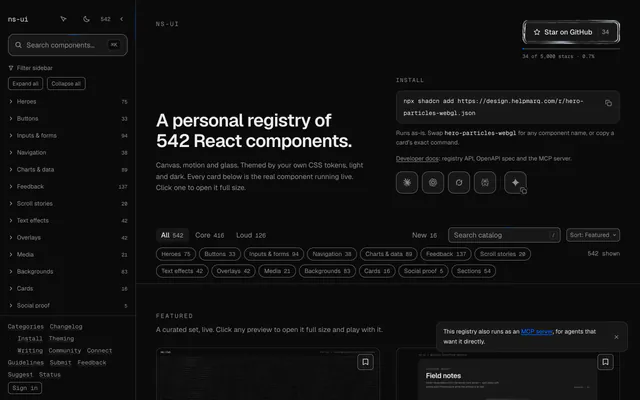
 ns-uiRegistryns-ui is an open-source registry of 542 React components, each built around one interaction, themed by your CSS tokens in light and dark.
 Warren UIRegistryWarren UI is an open-source shadcn registry of dense dashboard components: panels, sparklines, heatmaps, ledgers and incident timelines.
 stacked-progress-barLibrarystacked-progress-bar for shadcn/ui draws several segments in one track, with an optional legend, tooltips and progressbar semantics.
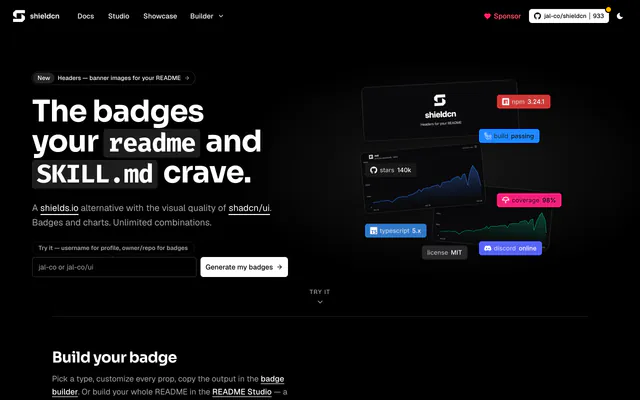
 shieldcnLibraryshieldcn is a free shields.io alternative that draws GitHub README badges and charts in the shadcn/ui style, for npm, Discord and 45+ providers.
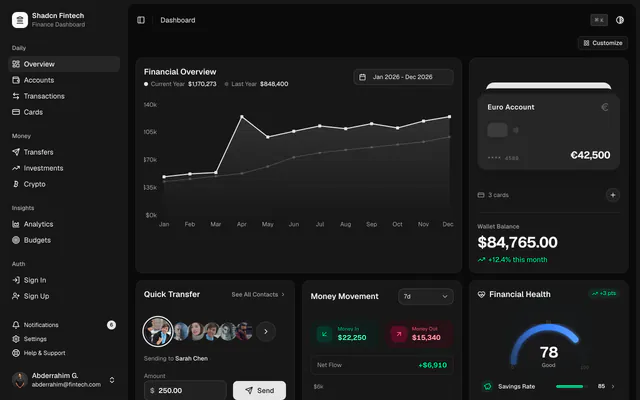
 Shadcn FintechTemplateShadcn Fintech is an MIT finance dashboard on Next.js 16 and Tailwind CSS v4, with 11 pages, flip-card UI, a live ticker and Clerk-powered sign-in.
 GraphitupToolGraphitup turns spreadsheet data into charts and dashboards with AI, plus free online graph makers that need no signup and export in any format.
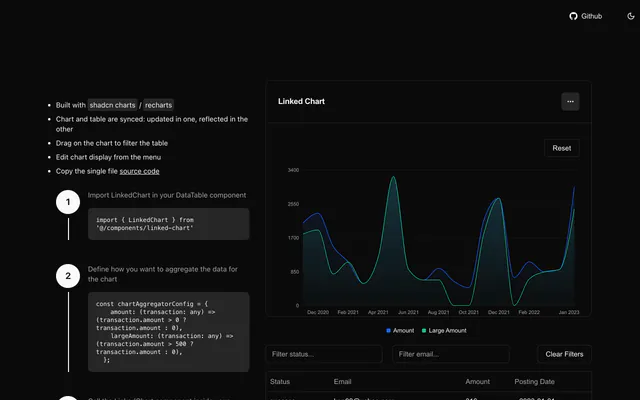
 Linked ChartLibraryLinked Chart syncs a Recharts chart with a TanStack DataTable in shadcn/ui: drag across the chart to filter the table, and aggregate data as you choose.
 Crypto ChartsLibraryCrypto Charts is a Next.js demo that draws shadcn/ui charts with Recharts, using free historical crypto data from Pyth. No credentials needed.
 Globe GraphAppGlobe Graph visualizes country data, from GDP per capita to internet users and unemployment, in charts you can explore year by year across countries.
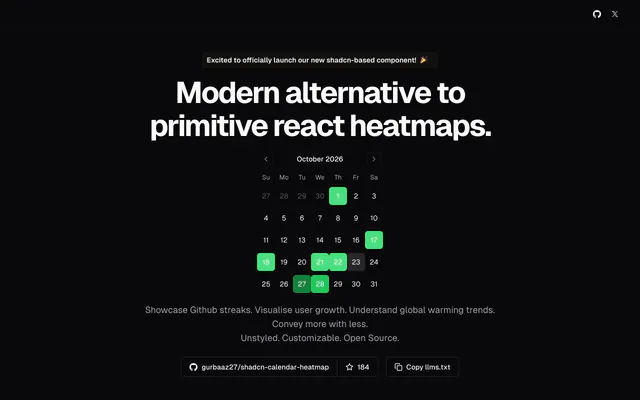
 Shadcn Calendar HeatmapLibraryShadcn Calendar Heatmap draws GitHub-style activity grids on a month calendar. It is accessible, customizable and open source, with classes per variant.
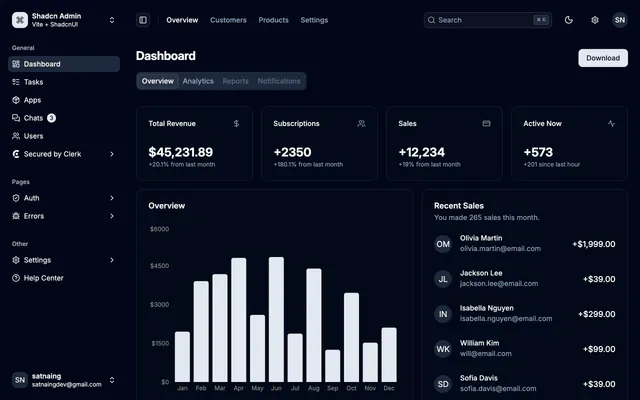
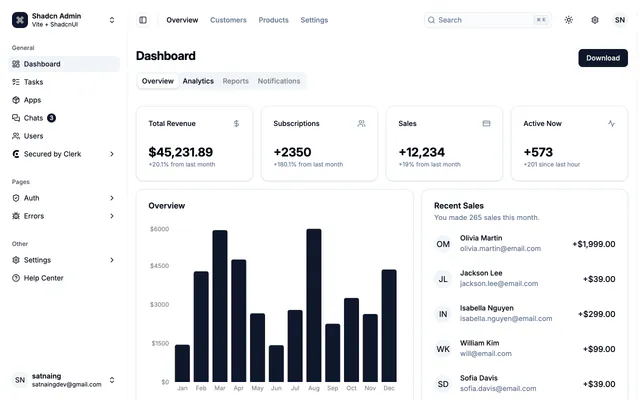 shadcn-adminLibraryshadcn-admin is an MIT-licensed admin dashboard UI for Vite and shadcn/ui, with stat cards, a monthly chart, tabs and a recent sales list ready to adapt.
 Sysinfocus simple/uiPortSysinfocus simple/ui is a free Razor component library for Blazor, inspired by shadcn/ui and built with HTML, vanilla CSS, JavaScript and C#.
 Zoomable Shadcn ChartLibraryZoomable Shadcn Chart is an MIT-licensed demo that adds click-and-drag and scroll zoom to a shadcn/ui chart built on Recharts, in about 280 lines.
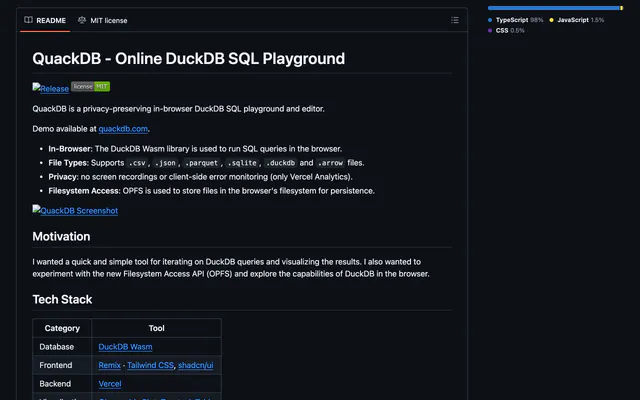
 QuackDBToolQuackDB is an open-source DuckDB SQL playground that runs in the browser with Wasm, reads local data files and charts results. MIT licensed.
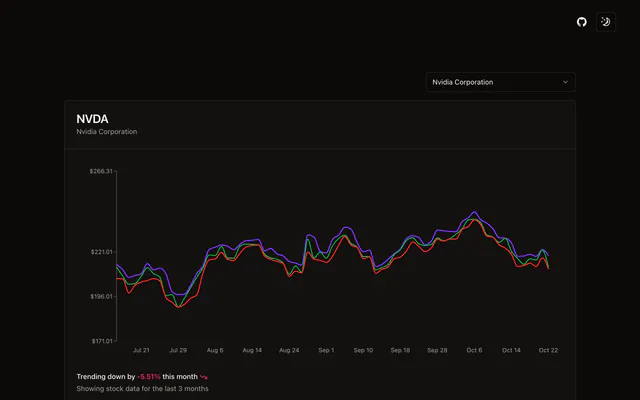
 Stock PickerAppStock Picker is a Next.js demo that picks a stock and plots three months of price history, using React Server Components and shadcn/ui charts.
 TremorLibraryTremor offers 35+ open-source, accessible React components for charts and dashboards, built on Recharts, Radix UI and Tailwind CSS. Copy and paste.
Pricing
Ship it with Pro
The directory is free. Pro adds 6,000+ blocks, 14 premium templates and the MCP server, so your AI editor installs them for you.
4.9/5 out of 5 · 150+ reviewsfrom 150+ founders and developers.
- Secure checkout via Stripe
- Code lives in your repo
- Keep what you've shipped if you cancel
- License terms
FAQ
Frequently asked questions
What the Charts tag marks and what its resources have in common.
The Charts tag marks resources in Awesome shadcn/ui that the directory describes by charts. It is one of 108 tags, in the topics group.
19 resources, out of 521 in the directory.
Dashboardblocks, SaaS Dashboard Starter, 000h and ns-ui, in the directory's own order: curated, then newest first.
The Charts tag is a topic tag. The tags page groups every tag by kind.
Libraries & Components (8), Component Registries (4), Boilerplates & Templates (2), Tools & Utilities (2), Apps & Platforms (2) and Framework Ports (1). The category tells you what each is for.
13 resources: ns-ui, stacked-progress-bar, shieldcn and Shadcn Fintech.
7 resources tagged Charts show a license GitHub confirmed: Dashboardblocks (MIT), SaaS Dashboard Starter (MIT), Shadcn Fintech (MIT) and shadcn-admin (MIT). Check the others' repositories.
3 resources tagged Charts list a shadcn CLI install command. For example, Dashboardblocks lists `npx shadcn@latest add @dashboardblocks/kpi-01`.
React, Dashboard, Components, Open source and Tailwind CSS, ordered by how many resources they share with Charts.
Open a related tag from the Also tagged row at the bottom of the page, or browse all 108 on the tags page.
Categories describe what a resource is for. Open the category of a Charts resource to see its peers: the categories page lists all 11.
With 19 resources, the Charts page is indexed by search engines.
Use the submit page: send the link to its website or repository through the contact form, which opens with the subject "Awesome shadcn/ui submission" already filled in. A person reads it and decides whether it is listed. Say what it is and what stack it uses; the tags are part of its record in the directory.
The directory holds no price, rating or star count, so a tag cannot say how good or how costly a resource is. Charts only describes it; read each resource's site before you depend on it.
4.9 out of 5 from 150+ developers


Found your stack? Ship it.
6,000+ blocks, premium templates and MCP in every Pro plan. The directory stays free.
Get Pro