shadcn.io is an independent project built on shadcn/ui
Installation
Overview
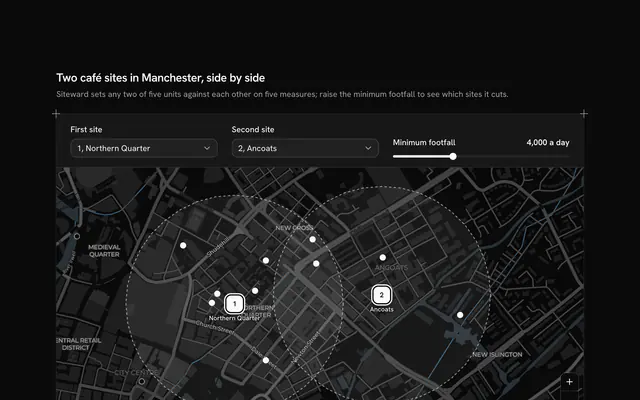
Track which building sites are running late with this construction sites map for React with Base UI. Gantryhill, a site management app, follows nine projects across Manchester and Salford, from Ancoats and the Northern Quarter to Salford Quays and Trafford Park, each at its neighbourhood's real place on a live Map that follows your theme, light or dark. Every marker is a ring that fills with the share of work done round the site's number, and a dot on the ring marks a site behind plan. Slippage is worked out from dates: the forecast finish against the planned one, in whole weeks, against a fixed "today", so a site reads "6 weeks behind", "On plan" or "1 week ahead". The rail at the start groups the sites as behind plan (the latest first) and on plan or ahead (the soonest handover first); choosing one, there or on the map, flies the camera to it and fills its card with a Progress bar, a Badge for the phase, the planned and forecast finishes and the weeks to handover. The card floats over the map on wide screens and sits under it on phones. Built from Map, Progress, Badge, Button and Guides. For contractors, developers, councils and anyone running a programme of works.
FAQ
How is behind plan decided?
slipDays counts the days from the planned finish to the forecast finish. More than three days is behind, rounded to whole weeks and never less than one; more than three days early is ahead; anything between is on plan. The weeks to handover count from AS_OF, a fixed date, so nothing reads the clock and the block shows the same thing on every visit.
Where do the phases come from?
From the share of work done alone: PHASES lists where each phase starts (Foundations at 10 percent, Structure at 30, Fit-out at 70, Handover at 90) and phaseOf picks the last one the site has reached. In your app take the phase from your programme and keep the ring as the work done.
How does the map fly to a site?
The block keeps one aim: every site, framed from the corners of their places, or the chosen one at street level. MapCamera frames the aim when the map starts and flies to each new one, quickly or not at all when reduced motion is on, leaving room on wide screens for the card floating at the map's start. Pan and zoom freely in between; the frame button under the zoom buttons aims at every site again.
What is real, and what stays local?
The neighbourhoods and their places are real; Gantryhill, the nine projects, the progress figures and every date in LINES are invented sample data. Nothing is saved or sent, and only the map tiles come over the network, from CARTO's basemaps over OpenStreetMap data, with their credit kept in the corner. In your app feed LINES from your project system.
Can I use it without a mouse?
Yes. Every site is a button in the rail with a pressed state, and choosing one there does what a click on its marker does; the zoom and frame buttons work from the keyboard, and the map itself takes the arrow keys and plus and minus once focused. A polite message reads out the chosen site's progress, slippage and handover once the choice settles.
How does it look on a phone?
The map comes first at a fixed height, then the chosen site's card, the caption and the rail's two groups under it. The card always holds the same lines, so choosing another site never moves what follows. Scrolling over the map scrolls the page; two fingers pan and zoom it.