shadcn.io is an independent project built on shadcn/ui
Installation
Overview
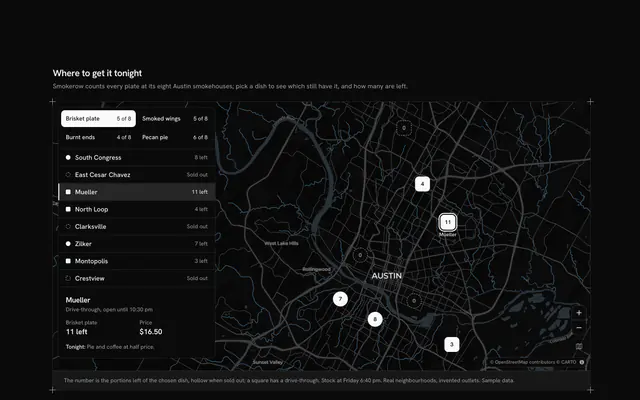
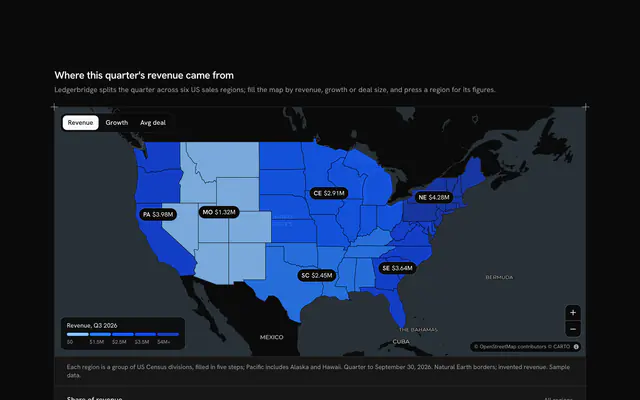
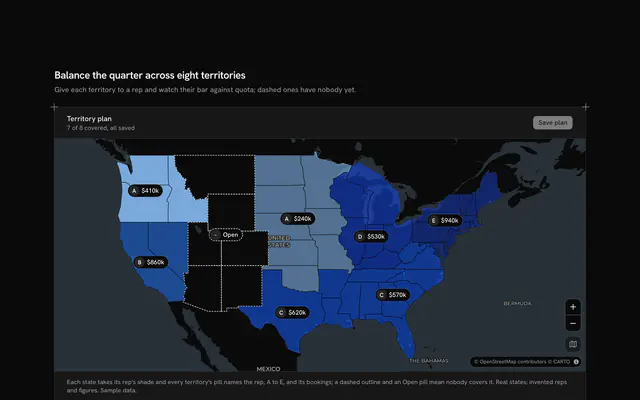
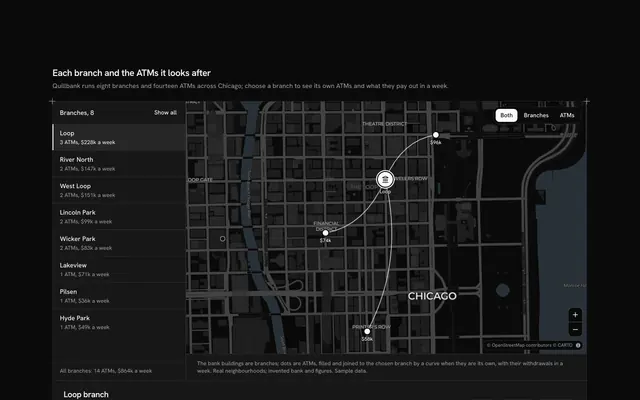
See which outlets carry a franchise, with this franchise map for React with Base UI. Burrowfield, a bakery franchise, puts twelve outlets in real towns along the California coast, from Bodega Bay to La Jolla, on a live Map that follows your theme. Each outlet is a bubble: its area follows the yearly revenue, its shape says its setting (a city circle, a suburban square, a small-town diamond) and the number in it is its rank. A card floats over the start of the map. Its Toggle Group picks the whole coast or the North, Central or South territory, flies the map to that stretch and fades the outlets outside it, on the map and in the card's ranking of all twelve by revenue, each with its royalty at a typed 6 percent in whole cents. The card's foot adds the territory up: outlets, revenue and royalties. Choosing an outlet, as a bubble or a row, flies the map to its town. Built from Map, Toggle Group and Guides. For franchise, retail-network and territory-planning tools.
FAQ
How are the bubbles sized and shaped?
By area, not width: widthOf takes the square root of an outlet's share of the top revenue, so twice the revenue covers twice the map, with a floor of 24 pixels. Squares and diamonds are drawn about 11 percent narrower than circles, so equal revenues cover equal areas whatever the setting. The caption shows the three shapes, and every row says the same figures in text.
How do the territory views work?
Each territory is the outlets typed with that region; its view is the corners of their places, which MapCamera frames with room for the card. Picking one flies there, fades the outlets outside it on the map and in the ranking, and adds its outlets up in the foot. Choosing an outlet outside the current territory switches back to the whole coast.
How is the royalty worked out?
royaltyOf takes a typed 6 percent of the yearly revenue and rounds to whole cents; the foot sums the territory's revenue first and takes 6 percent of the sum. Revenue is typed in dollars in LINES and kept in cents. The towns are real; Burrowfield, its outlets and every figure are invented sample data, and nothing is billed.
Can I use it without a mouse?
Yes. The territories are a toggle group that takes the arrow keys, every outlet is a button in the ranking with a pressed state, and the zoom buttons and the map itself (arrows, plus and minus) work from the keyboard. The bubbles are a pointer shortcut to the same choice. A polite message gives the territory's totals and the chosen outlet's rank once the choice settles.
How does it look on a phone?
Below 64rem the card docks under the map instead of floating over it, and the map frames the coast without leaving room for it. On a phone the bubbles shrink and drop their numbers so the coast stays readable, and the ranking under the map gives every rank in text. The list keeps all twelve rows for every territory, so the page never jumps.
Where do the map and the data come from?
The tiles are CARTO's basemaps over OpenStreetMap data, loaded by MapLibre GL under the Map component, with their credit kept in the corner. Everything else is typed in the file and nothing is fetched. Scrolling the page over the map scrolls the page: hold Ctrl or ⌘ to zoom, or use two fingers on a phone.