shadcn.io is an independent project built on shadcn/ui
Installation
Overview
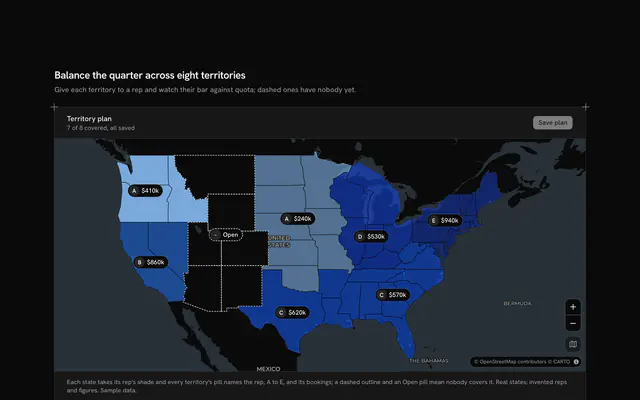
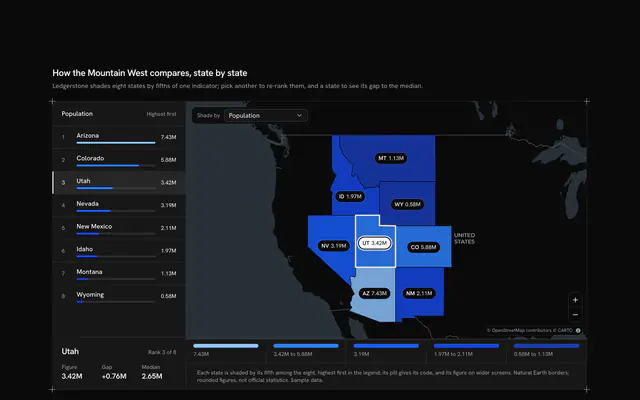
See where the quarter's revenue came from, with this revenue by region map for React with Base UI. Ledgerbridge, a revenue reporting tool, splits the quarter across six US sales regions, each a group of Census divisions, and fills their states on a live Map that follows your theme, using Natural Earth's state borders and five steps of the theme's chart colours. A Toggle Group floating over the map picks what the fill shows: revenue, growth on the quarter before, or the average deal, with a legend of the five steps; a pill on each region carries its value. Under the map a proportion bar, one button per region sized by its share of revenue (never narrower than its code) and ordered from the largest, is both the legend of the shares and a control: pressing a segment, a region on the map or its pill outlines that region's states and fills the three cells under it (revenue and its share, growth as a signed number with an arrow, the average deal and the number of deals); pressing it again goes back to the total. Shares are whole percentages that add to exactly 100. Built from Map, Toggle Group and Guides. For finance, sales-ops and reporting tools.
FAQ
How are the regions drawn?
From the one file the block loads, Natural Earth's US states (ne_110m_admin_1_states_provinces, pinned on jsDelivr). Each state carries its Census division, and each region in LINES lists the divisions it groups, so a fill expression colours every state of a region alike. Pacific includes Alaska and Hawaii, which sit outside the frame; zoom out to see them.
How is a region's colour chosen?
Each measure has five steps with fixed lower bounds (for revenue, under $1.5M, then $1.5M, $2.5M, $3.5M and $4M), and a region takes the colour of the highest step it reaches, from the light end of the theme's chart ramp to the dark end. The legend shows the steps, the pills and the cells show the exact values, and the swatch on each bar segment repeats its region's step.
What stays local?
Everything but the map: the tiles and the state borders are loaded by the map, and the revenue, the regions and Ledgerbridge are typed sample data for an invented quarter. Nothing is sent. In your app load the current and prior quarter per region from your warehouse; the three measures all come from the same rows, so the toggle reloads nothing.
Can I use it without a mouse?
Yes. The toggle group is one tab stop with arrow keys, and each segment of the bar is a button with a pressed state that chooses a region; clicking a state or a pill on the map is a pointer shortcut to the same choice. The map's zoom buttons work from the keyboard, and a polite message reads the region's figures once the choice settles.
How does it look on a phone?
The map comes first with the toggle over it and each pill reduced to its region's code; the legend moves under the map, and the bar keeps one row, showing the percentage only in segments wide enough for it. The three cells share one row, and nothing changes height between measures.