shadcn.io is an independent project built on shadcn/ui
Installation
Overview
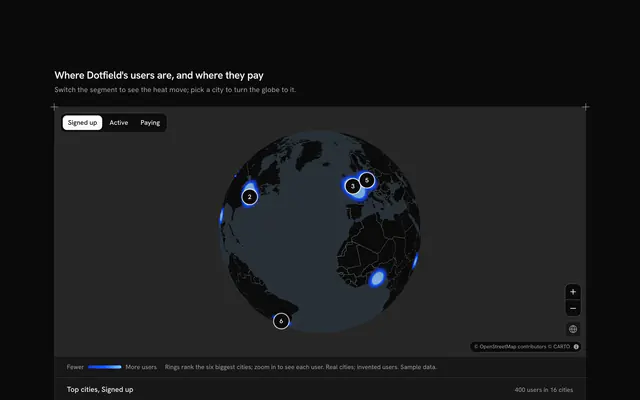
See where a website's visitors come from at a glance, with this traffic heatmap globe for React with Base UI. Hitmark, a website analytics tool, draws a live Map as a globe that follows your theme and warms it with a heatmap of visits round the cities they start in, hottest where most land, the rest of the world included. A Toggle Group over the globe picks the period (7, 30 or 90 days, three typed sets) and the heat and every count change with it. The rail at the start ranks the eight top countries by visitors, each with its share of the total as a bar, and the rest of the world under them; pressing a country, or its dot on the globe, turns the globe to face it and names it on the map with its count, and the globe button turns back to the whole view. The globe never spins on its own: drag it, or use the zoom buttons. Built from Map, Toggle Group, Button and Guides. For analytics dashboards, marketing sites and SaaS admin panels.
FAQ
Where do the visits come from, and is anything tracked?
Nothing is tracked or fetched but the map tiles. The countries and cities are real; the visitor counts in COUNTRY_LINES and REST and each city's share in CITY_LINES are invented sample data. The heat's points are scattered round each city from a fixed seed, so the globe looks the same on every load. In your app, feed the same shapes from your analytics by country and city.
How is the heat worked out?
Each city's share of its country's visitors is spread over nine points near it, and each point carries its part of the visits as a weight. The heatmap counts the busiest point of the period fully and the rest in proportion, so the hottest places are where most visits start, in the theme's chart colours from light to dark. The rail gives the same figures in numbers.
What does the period toggle change?
It picks one of three typed sets, the last 7, 30 or 90 days. The heat, the total, the ranking (India passes Germany over the longer periods, for instance), the share bars and the rest of the world all change together, and the status line reads out the new leader once the choice settles.
Can I use it without a mouse?
Yes. The period is a toggle group and every country in the rail is a button that turns the globe to face it, as clicking its dot does. The zoom and globe buttons work from the keyboard, and the focused globe takes the arrow keys and plus and minus. The globe itself never moves on its own, so nothing needs pausing.
How does it look on a phone?
The globe comes first, drawn smaller so the whole of it fits, with the period toggle over it. The rail moves under it with all eight countries and the rest of the world. Scrolling over the globe scrolls the page; two fingers turn it.
Why a globe and not a flat map?
Visitors come from every continent, and a flat map that shows them all at once stretches the north and can't centre on both the Americas and Asia. The globe keeps sizes true and turns to whichever country you choose; the Map component draws it with projection="globe", and the markers hide as they pass behind it.