shadcn.io is an independent project built on shadcn/ui
Installation
The command adds the example above to components/charts/ and, the first time, the chart kit to components/ui/charts/. Both are source files in your project from then on: read them, change them, delete what you don't use.
Usage
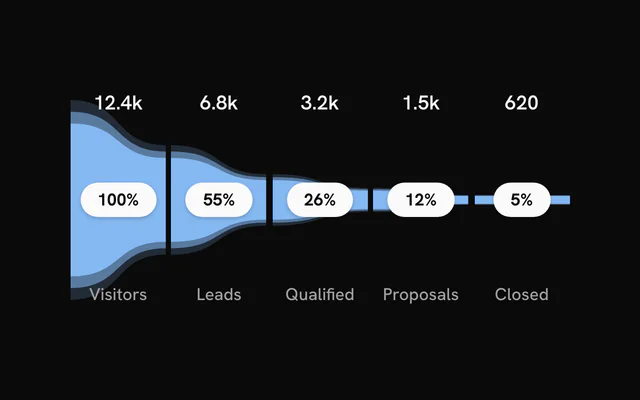
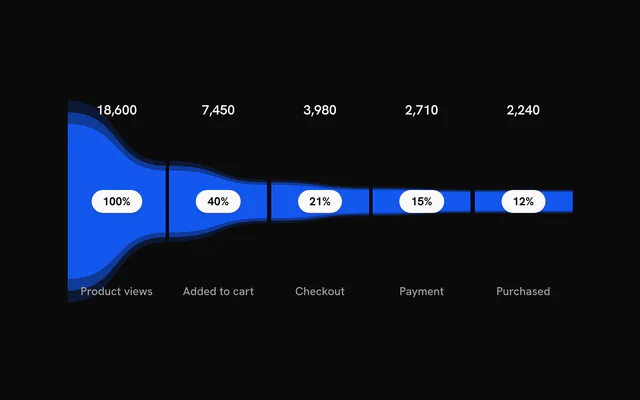
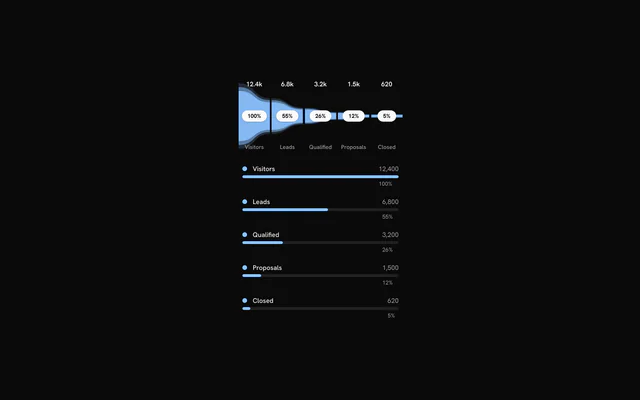
Pass the stages in order, widest first, each with a label and a value. The first stage counts as 100% and every other segment is sized against it. To show a number your own way, such as 12.4k, set displayValue.
import { FunnelChart } from "@/components/ui/charts";

const data = [
  { label: "Visited", value: 18_200 },
  { label: "Signed up", value: 4300 },
  { label: "Activated", value: 2150 },
  { label: "Paid", value: 610 },
];

export const SignupFunnel = () => (
  <FunnelChart ariaLabel="Signup funnel, last 30 days" data={data} />
);
Anatomy
The funnel is a single component. The stages come from data and everything else is a prop, including a function for pattern fills.
<FunnelChart
  color="var(--chart-2)"
  data={data}
  edges="straight"
  grid
  layers={2}
  orientation="vertical"
/>FunnelChart: The stages, the halo rings around each, their labels and an optional grid behind them.
Vertical and straight
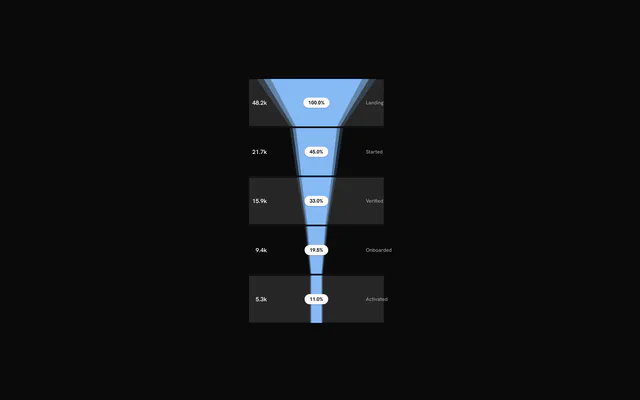
orientation="vertical" runs the stages from top to bottom, and edges="straight" joins them with straight lines instead of curves. The two are independent, so all four combinations work.
Values, shares and names
Each segment shows its value, its share of the first stage and its name. showValues, showPercentage and showLabels turn each one off, and formatValue and formatPercentage change how the numbers read.
labelLayout="grouped" stacks the three together inside the segment, and labelAlign moves the stack to its start, center or end.
Colors and gradients
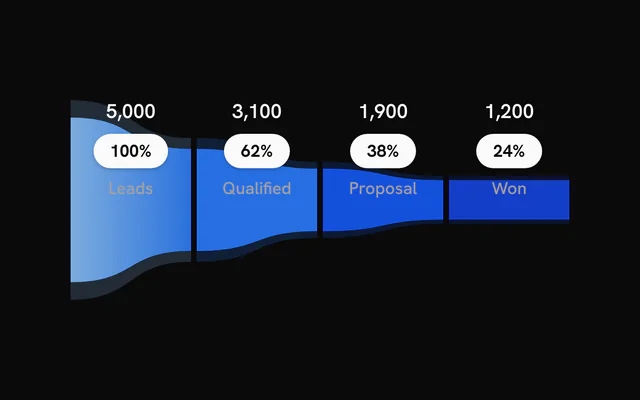
color sets every stage at once. A stage's own color overrides it, and gradient takes a list of stops for that segment, such as two theme colors.
Bands and grid lines
grid adds alternating bands behind the stages and a line at each gap between them. Pass an object instead of true to keep only one of the two or restyle it: bands, bandColor, lines, lineColor, lineOpacity, lineWidth.
Hover and controlled state
The hovered stage's halo rings spring outward and the other stages fade to 40%. hoveredIndex and onHoverChange make that hover controlled, so something outside the chart can follow it, such as this readout of the drop-off from the stage before.
Hand the same state to a <ChartLegend> and its rows highlight with the stages.
Customization
The kit is in your project, in components/ui/charts/: your framework's components over a shared core/. Change a default there and every chart picks it up.
class goes on the chart's container, so size and spacing are utility classes.
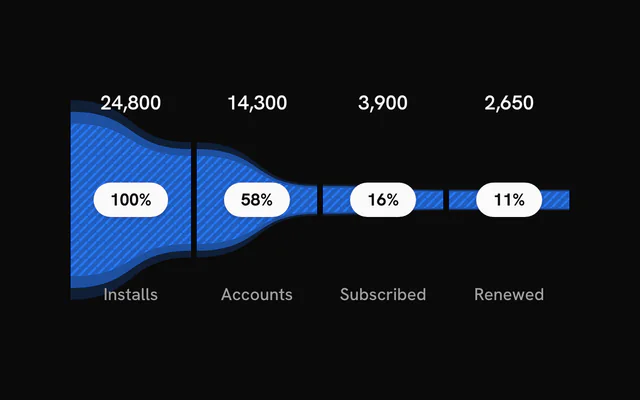
Pattern fills come from renderPattern, which the chart calls once per stage with a unique id and the stage's color. Return a <pattern> with that id and it fills the segment. The halo rings around it stay solid.
layers sets how many halo rings each segment has (3), and gap the space between stages (4 px).
<FunnelChart
  data={data}
  renderPattern={(id, color) => (
    <pattern height={6} id={id} patternUnits="userSpaceOnUse" width={6}>
      <rect fill={color} fill-opacity={0.35} height={6} width={6} />
      <path d="M0 6 L6 0" stroke={color} stroke-width={1.5} />
    </pattern>
  )}
/>
Where a part renders content of its own, you pass it in. In Solid:
FunnelChart:renderPattern={(id, color) => …}
Loading state
The funnel has no loading state. Hold its place with a Skeleton of the same height until the stages arrive.
Animation
The segments grow in one after another, staggerDelay (0.12 s) apart, and each stage's labels fade in a quarter of a second after it.
enterTransition takes a motion-style transition for the growth: a 1.1 s tween unless you pass another, or a spring.
Theming
Every color in the kit is one of your theme's tokens or a mix of them, except --chart-positive, a fixed green. A preset or the .dark class restyles the chart, and overriding a token in your CSS changes it everywhere.
Every stage is --chart-1 unless you set color on the chart or on a stage. The grid's bands are your theme's --muted and its lines --chart-grid.
The labels follow the theme directly: values in --foreground, names in --muted-foreground, and the percentage on a --foreground badge.
| Token | Default | Paints |
|---|---|---|
--chart-1 | your theme's | the first series |
--chart-grid | --border | grid lines |
:root {
  --chart-grid: var(--muted);
}
Accessibility
The chart is an image named by ariaLabel ("Funnel chart" by default), and its labels are part of that image. Put the conversion you care about in ariaDescription, from the first stage to the last.
Focus steps through the stages and highlights each one as hover does, calling onHoverChange on the way.
- Tab
- Moves focus to the chart and highlights the first stage.
- Arrow Right
- Moves to the next stage. ArrowDown does the same.
- Arrow Left
- Moves to the previous stage. ArrowUp does the same.
- Home
- Jumps to the first stage.
- End
- Jumps to the last stage.
API reference
Solid takes the same props as React, with class for className. A render prop is a function, called again when its arguments change, so destructured parameters stay current.
FunnelChart
dataFunnelStage[]
The stages, in order from widest to narrowest. The chart renders nothing when this is empty.
orientation?"horizontal" | "vertical"
"horizontal" lays the stages out left to right; "vertical" top to bottom.
- Type
"horizontal" | "vertical"- Default
"horizontal"
color?string
Default colour of the stages. A stage's own color or gradient overrides it.
- Default
"var(--chart-1)"
layers?number
Number of concentric halo rings drawn for each stage.
- Default
3
class?string
Extra class name for the chart container.
style?CSSProperties
Inline styles for the chart container.
showPercentage?boolean
Show each stage's share of the first stage as a badge.
- Default
true
showValues?boolean
Show each stage's value.
- Default
true
showLabels?boolean
Show each stage's name.
- Default
true
hoveredIndex?number | null
Index of the hovered stage, for controlled hover. Pass null for no hover; leave it undefined to let the chart manage hover itself.
- Type
number | null
onHoverChange?(index: number | null) => void
Called with the index of the hovered or keyboard-focused stage, or null when hover ends.
- Type
(index: number | null) => void
formatPercentage?(pct: number) => string
Formats a percentage (0 to 100) for the badge. Defaults to a rounded whole number with a % sign.
- Type
(pct: number) => string
formatValue?(value: number) => string
Formats a stage value for display. Defaults to a whole number with locale grouping.
- Type
(value: number) => string
staggerDelay?number
Delay between one stage's entrance and the next, in seconds.
- Default
0.12
enterTransition?Transition
Transition for the stage entrance, in the shape used by the motion library: a tween (duration in seconds, default 1.1, and ease, a four-number cubic-bezier or one of motion's named eases such as "easeOut") or type: "spring" (stiffness, damping, mass, or duration and bounce).
gap?number
Gap between stages in pixels.
- Default
4
renderPattern?(id: string, color: string) => ReactNode
Returns a pattern definition (for example an SVG <pattern>) for each stage, called with a unique id and the stage colour. The pattern paints the innermost ring; the outer halo rings stay solid.
- Type
(id: string, color: string) => ReactNode
edges?"curved" | "straight"
"curved" joins stages with smooth curves; "straight" uses straight edges.
- Type
"curved" | "straight"- Default
"curved"
labelLayout?"spread" | "grouped"
"spread" places the value, percentage and name apart within the segment; "grouped" stacks them together.
- Type
"spread" | "grouped"- Default
"spread"
labelOrientation?FunnelLabelOrientation
Stack direction of grouped labels. Only used with labelLayout="grouped". Defaults to "vertical" for horizontal funnels and "horizontal" for vertical ones.
labelAlign?FunnelLabelAlign
Where grouped labels sit in their segment: "center", "start" (top or left) or "end" (bottom or right). Only used with labelLayout="grouped".
- Default
"center"
grid?boolean | { readonly bands?: boolean; readonly bandColor?: string; readonly lines?: boolean; readonly lineColor?: string; readonly lineOpacity?: number; readonly lineWidth?: number }
Background bands and grid lines. true enables both with default styling; an object adjusts them. Off by default.
- Type
boolean | { readonly bands?: boolean; readonly bandColor?: string; readonly lines?: boolean; readonly lineColor?: string; readonly lineOpacity?: number; readonly lineWidth?: number }- Default
false
ariaLabel?string
Accessible name of the chart.
- Default
"Funnel chart"
ariaDescription?string
Longer accessible description of the chart. Default: a summary of its stages.
dataTable?ChartDataTableProps
The chart's data as an HTML table (a <ChartDataTable>'s props: the funnel takes no children): {} for a visually hidden table, { toggle: true } for a "View as table" button.
Examples
11 examples on Solid, each live with its code and its own install command.