shadcn.io is an independent project built on shadcn/ui
Installation
The command adds the example above to components/charts/ and, the first time, the chart kit to components/ui/charts/. Both are source files in your project from then on: read them, change them, delete what you don't use.
Usage
Each row has a category, an estimate and the interval's two bounds. Point <ErrorBar> at them with dataKey, lowKey and highKey.
import {
  BarXAxis,
  BarYAxis,
  ChartTooltip,
  ErrorBar,
  ErrorBarChart,
  Grid,
} from "@/components/ui/charts";

const data = [
  { name: "Control", rate: 3.2, low: 2.8, high: 3.6 },
  { name: "New pricing page", rate: 3.9, low: 3.4, high: 4.4 },
  { name: "Annual by default", rate: 3.5, low: 3.1, high: 3.9 },
];

export const ExperimentChart = () => (
  <ErrorBarChart
    ariaLabel="Trial conversion by variant"
    data={data}
    reference={3.2}
  >
    <Grid horizontal />
    <ErrorBar
      dataKey="rate"
      highKey="high"
      intervalLabel="95% CI"
      label="Conversion"
      lowKey="low"
    />
    <BarXAxis />
    <BarYAxis />
    <ChartTooltip />
  </ErrorBarChart>
);
Anatomy
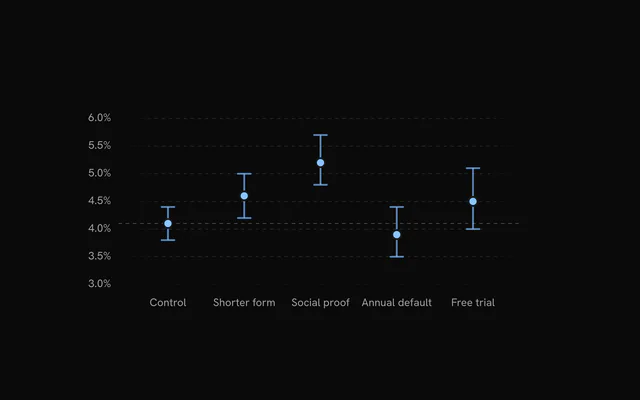
Two charts share this page. ErrorBarChart puts an interval on each category and is the one laid out here. RibbonChart, for ranges over time, has its own section below.
<ErrorBarChart data={data} reference={4.1} xDataKey="variant">
  <Grid horizontal />
  <ErrorBar dataKey="rate" highKey="high" lowKey="low" />
  <BarXAxis />
  <BarYAxis />
  <ChartTooltip />
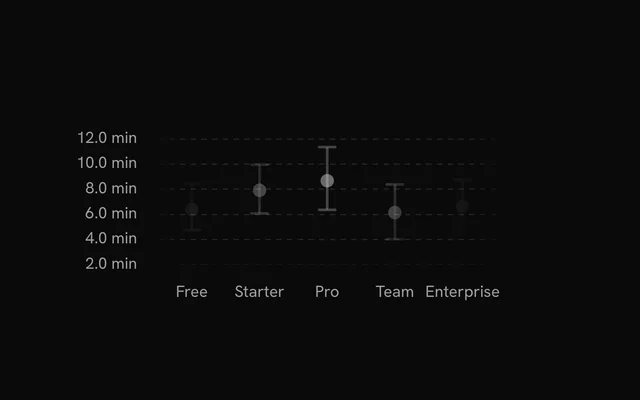
</ErrorBarChart>ErrorBarChart: Gives each row a band.referenceadds a dashed line at one value, such as the control or zero.Grid: Guide lines across the value axis.ErrorBar: The interval fromlowKeytohighKey, a cap on each end and a dot on the estimate.BarXAxis: The categories, or the values on a horizontal chart.BarYAxis: The values, or the categories on a horizontal chart.ChartTooltip: The estimate and its interval, named bylabelandintervalLabel.
Forest plots
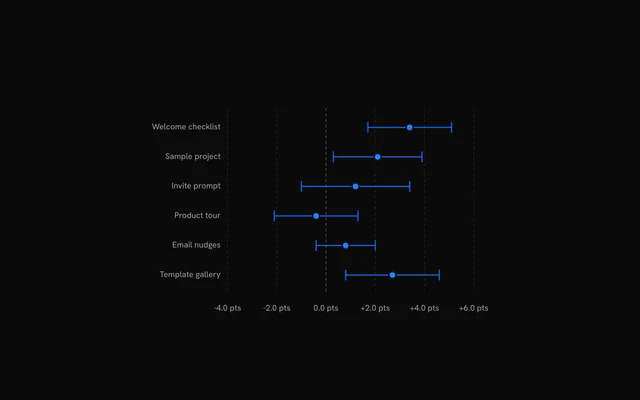
With orientation="horizontal" the intervals run left to right and the categories go down the side, the usual layout for a forest plot. Set reference={0} to draw the line of no effect, and widen margin.left for long labels.
Ribbons over time
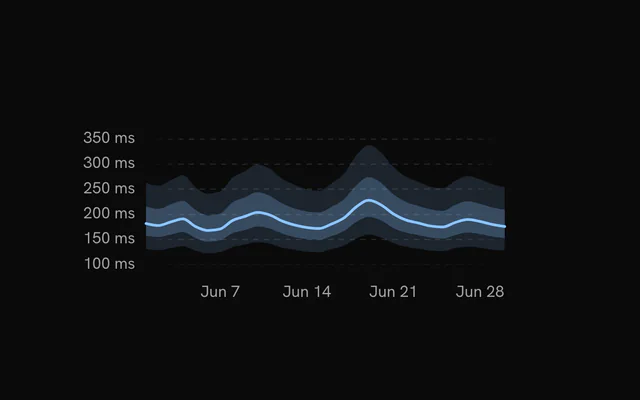
RibbonChart takes rows with a date under xDataKey (date by default) and uses XAxis and YAxis for its axes. Each <Ribbon> fills the space between lowKey and highKey, and each <RibbonLine> draws a line through dataKey.
Ribbons draw in the order you write them. Put the widest first with the lowest fillOpacity, so nested bands read from the outside in.
Forecasts
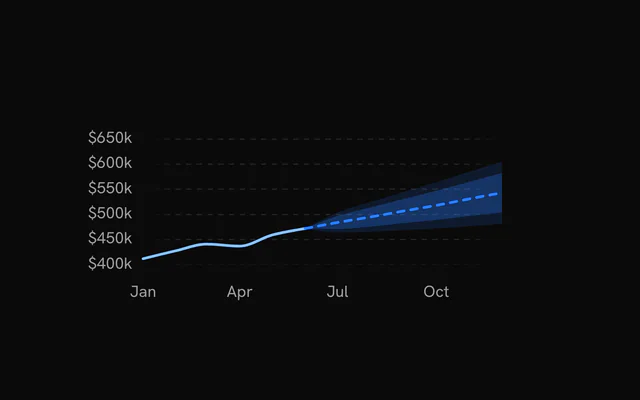
A line or ribbon skips the rows where its fields are missing, so the actuals can stop where the forecast starts. Give the forecast's first row the last actual value, with both bounds equal to it, and the intervals fan out from there.
Mark the forecast with strokeDasharray="5 5" on its <RibbonLine>.
Customization
The kit is in your project, in components/ui/charts/: your framework's components over a shared core/. Change a default there and every chart picks it up.
class goes on the chart's container, so size and spacing are utility classes.
<ErrorBar> takes color, strokeWidth for the interval, radius for the estimate's dot, and showCaps and capWidth (14 px) for the caps. A row with its own color field gets that color on its interval and caps, which is a quick way to pick out the winning variant.
Name the interval with intervalLabel so the tooltip says what it is. The default is "Range".
<ErrorBar
  capWidth={8}
  color="var(--chart-2)"
  dataKey="rate"
  highKey="high"
  intervalLabel="90% interval"
  label="Conversion"
  lowKey="low"
  radius={4}
/>
Where a part renders content of its own, you pass it in. In Solid:
ChartTooltip:content={({ point, index }) => …}
Loading state
Both charts take status="loading": the marks turn into a shimmering skeleton and the pointer is ignored until you switch to "ready", which plays the entrance.
With nothing to pass yet, render <ErrorBarChartLoading /> or <RibbonChartLoading /> in the chart's place.
Animation
Each interval grows from its low end to its high end, one category after another, over animationDuration (1100 ms). The estimate pops in partway and the caps fade in once the intervals are out. Ribbons and lines wipe in from left to right instead.
Pass animate={false} to either chart to skip the entrance.
Theming
Every color in the kit is one of your theme's tokens or a mix of them, except --chart-positive, a fixed green. A preset or the .dark class restyles the chart, and overriding a token in your CSS changes it everywhere.
Intervals, estimates, ribbons and lines all default to --chart-1. The reference line uses --chart-foreground-muted, so it reads as a guide rather than data.
| Token | Default | Paints |
|---|---|---|
--chart-1 | your theme's | the first series |
--chart-2 | your theme's | the second series |
--chart-foreground-muted | --muted-foreground mixed toward --background | skeletons and faded marks |
--chart-background | --card | dot halos, the gaps between stacked marks |
--chart-grid | --border | grid lines |
--chart-label | --muted-foreground | tick labels |
--chart-crosshair | --muted-foreground at 75% | the hover line |
--chart-tooltip-background | --popover | the tooltip panel |
:root {
  --chart-background: var(--background);
  --chart-grid: var(--muted);
}
Accessibility
Each chart is an image named by ariaLabel ("Error bar chart" or "Ribbon chart" by default). Say what the interval means in the label or in ariaDescription, for example "95% confidence interval", because a screen reader gets no whiskers or bands.
- Tab
- Moves focus to the chart and its first category, or its first date on a ribbon chart.
- Arrow Right
- Moves to the next category or date. ArrowDown does the same.
- Arrow Left
- Moves to the previous one. ArrowUp does the same.
- Home
- Jumps to the first one.
- End
- Jumps to the last one.
API reference
Solid takes the same props as React, with class for className. A render prop is a function, called again when its arguments change, so destructured parameters stay current.
ErrorBarChart
datareadonly Record<string, unknown>[]
The rows, one estimate each, in the order given.
- Type
readonly Record<string, unknown>[]
xDataKey?string
The key of each row's category label.
- Default
"name"
orientation?"vertical" | "horizontal"
"vertical" stands the intervals up; "horizontal" runs them left to right down a list of categories (a forest plot).
- Type
"vertical" | "horizontal"- Default
"vertical"
aspectRatio?string | number
Aspect ratio of the chart, as "width / height" or a number.
- Type
string | number- Default
"2 / 1"
margin?Partial<ChartMargin>
Space around the plot in px.
- Type
Partial<ChartMargin>
reference?number
A value to mark with a dashed rule across the plot (no effect, a target, a benchmark).
animate?boolean
Animate the intervals in on mount: each grows from its low end to its high end, its estimate following.
- Default
true
animationDuration?number
Length of the entrance in milliseconds.
- Default
1100
ariaLabel?string
Accessible name of the chart.
- Default
"Error bar chart"
ariaDescription?string
Longer accessible description of the chart.
class?string
Extra class name for the chart container.
style?CSSProperties
Inline styles for the chart container.
children?ReactNode
The chart's parts: ErrorBar, Grid, BarXAxis, BarYAxis and ChartTooltip.
status?ChartStatus
"loading" draws a shimmering skeleton shaped like the chart in place of its marks and ignores the pointer; switching to "ready" plays the chart's entrance.
- Default
"ready"
loadingLabel?string
Centered label shown over the plot while status is "loading".
ErrorBar
dataKeystring
The key of each row's estimate.
lowKeystring
The key of each row's low bound.
highKeystring
The key of each row's high bound.
label?string
The estimate's name in the tooltip. Defaults to dataKey.
intervalLabel?string
The interval's name in the tooltip, for example "95% CI".
- Default
"Range"
color?string
Colour of the intervals and estimates. A row's own color field wins.
- Default
"var(--chart-1)"
showCaps?boolean
Draw a cap across each end of the interval.
- Default
true
capWidth?number
Width of a cap in px.
- Default
14
strokeWidth?number
Width of the interval's line in px.
- Default
2
radius?number
Radius of the estimate's dot in px.
- Default
5
formatValue?(value: number) => string
Formats a value in the tooltip and on the value axis. Defaults to a grouped number.
- Type
(value: number) => string
fadedOpacity?number
Opacity of the other rows while one is hovered.
- Default
0.3
RibbonChart
datareadonly Record<string, unknown>[]
The rows, one per time, oldest first: each holds its date under xDataKey and the bounds the Ribbons and RibbonLine read.
- Type
readonly Record<string, unknown>[]
xDataKey?string
The key of each row's date (a Date, an ISO string or epoch milliseconds).
- Default
"date"
aspectRatio?string | number
Aspect ratio of the chart, as "width / height" or a number.
- Type
string | number- Default
"2 / 1"
margin?Partial<ChartMargin>
Space around the plot in px.
- Type
Partial<ChartMargin>
animate?boolean
Animate the ribbons and the line in on mount.
- Default
true
animationDuration?number
Length of the entrance in milliseconds.
- Default
1100
ariaLabel?string
Accessible name of the chart.
- Default
"Ribbon chart"
ariaDescription?string
Longer accessible description of the chart.
class?string
Extra class name for the chart container.
style?CSSProperties
Inline styles for the chart container.
children?ReactNode
The chart's parts: Ribbons (widest first), RibbonLines, Grid, XAxis, YAxis and ChartTooltip.
status?ChartStatus
"loading" draws a shimmering skeleton shaped like the chart in place of its marks and ignores the pointer; switching to "ready" plays the chart's entrance.
- Default
"ready"
loadingLabel?string
Centered label shown over the plot while status is "loading".
Ribbon
lowKeystring
The key of each row's low bound.
highKeystring
The key of each row's high bound.
label?string
The band's name in the tooltip, for example "10th–90th percentile". Defaults to lowKey–highKey.
fill?string
Colour of the band.
- Default
"var(--chart-1)"
fillOpacity?number
Opacity of the band's fill. Nested bands read best widest-faintest.
- Default
0.2
RibbonLine
dataKeystring
The key of each row's value.
label?string
The line's name in the tooltip. Defaults to dataKey.
stroke?string
Colour of the line.
- Default
"var(--chart-1)"
strokeWidth?number
Width of the line in px.
- Default
2
strokeDasharray?string
Dash pattern of the line, for example "4 4" for a forecast.
formatValue?(value: number) => string
Formats a value in the tooltip and on the value axis. Defaults to a grouped number.
- Type
(value: number) => string
Grid
horizontal?boolean
Show horizontal grid lines.
- Default
true
vertical?boolean
Show vertical grid lines.
- Default
false
numTicksRows?number
Number of horizontal grid lines. Ignored when rowTickValues is set.
- Default
5
numTicksColumns?number
Number of vertical grid lines.
- Default
10
rowTickValues?number[]
Explicit y values for the horizontal grid lines. Overrides numTicksRows.
stroke?string
Color of the grid lines.
- Default
"var(--chart-grid)"
loadingStroke?string
Grid color while the chart is loading. Falls back to stroke.
strokeOpacity?number
Opacity of the grid lines.
- Default
1
strokeWidth?number
Width of the grid lines in px.
- Default
1
strokeDasharray?string
Dash pattern of the grid lines.
- Default
"4,4"
highlightRowValues?number[]
Y values of horizontal lines drawn with the highlight styling, for example a zero baseline.
highlightRowStroke?string
Color of the highlighted rows.
- Default
"var(--chart-foreground-muted)"
highlightRowStrokeOpacity?number
Opacity of the highlighted rows.
- Default
1
highlightRowStrokeWidth?number
Width of the highlighted rows in px.
- Default
1
highlightRowStrokeDasharray?string
Dash pattern of the highlighted rows.
- Default
"0"
fadeHorizontal?boolean
Fade the horizontal lines toward transparent at the left and right edges.
- Default
true
fadeVertical?boolean
Fade the vertical lines toward transparent at the top and bottom edges.
- Default
false
hideHorizontalEdgeLines?boolean
Drop the first and last horizontal line (kept when two or fewer remain).
- Default
false
hideVerticalEdgeLines?boolean
Drop the first and last vertical line (kept when two or fewer remain).
- Default
false
shimmer?boolean
While the chart is loading, sweep a bright band across the grid.
- Default
false
shimmerStroke?string
Color of the shimmer band.
- Default
"color-mix(in oklch, var(--bkm-foreground) 68%, transparent)"
shimmerSpeed?number
Speed multiplier of the shimmer sweep. 2 is twice as fast.
- Default
1
BarXAxis
tickerHalfWidth?number
Half-width in px of the zone around the date pill inside which tick labels are hidden.
- Default
50
showAllLabels?boolean
Show every category label, even where they overlap, instead of thinning them to maxLabels and to the plot width.
- Default
false
maxLabels?BarLabelCount
Maximum number of category labels when showAllLabels is off. Fewer are shown, evenly spaced, when that many would not fit the plot width. Pass { base, sm, md, lg, xl } to vary it with the chart's width (640, 768, 1024 and 1280 px and up).
- Default
12
BarYAxis
showAllLabels?boolean
Horizontal charts: show every category label instead of thinning to maxLabels.
- Default
true
maxLabels?number
Horizontal charts: maximum number of category labels when showAllLabels is off.
- Default
20
numTicks?number
Vertical charts: target number of value ticks. Grid settings take precedence.
- Default
5
formatLargeNumbers?boolean
Vertical charts: abbreviate values of 1000 and above as thousands, for example 2k.
- Default
true
formatValue?(value: number) => string
Vertical charts: formats a value tick into its label. Overrides formatLargeNumbers.
- Type
(value: number) => string
XAxis
numTicks?number | ResponsiveChartLabelCount
Target number of tick labels along the x axis, or one per chart width: { base, sm, md, lg, xl } takes the count of the widest breakpoint the chart reaches (640, 768, 1024 and 1280 px).
- Type
number | ResponsiveChartLabelCount- Default
5
labels?readonly string[]
The tick text of each data row, in row order: it replaces the date formatting (pair it with ChartTooltip dateLabels).
tickerHalfWidth?number
Half-width in px of the zone around the date pill inside which tick labels are hidden. Line, area and composed charts widen it to the pill's half-width plus the widest tick label's, so no label sits half under the pill.
- Default
50
tickMode?"domain" | "data"
Where ticks fall: "data" places them on evenly spaced data rows, "domain" places them at evenly spaced time values across the x domain.
- Type
"domain" | "data"- Default
"data"
formatValue?(value: Readonly<Date>) => string
Formats a tick date into its label. Defaults to a short month and day such as "Jan 5".
- Type
(value: Readonly<Date>) => string
YAxis
yAxisId?string | number
Id of the y scale this axis labels. Must match the yAxisId of the series that use it.
- Type
string | number- Default
"left"
orientation?"left" | "right"
Side of the plot the axis sits on. The primary axis is on the left; additional axes default to the right.
- Type
"left" | "right"- Default
"left"
numTicks?number
Target number of tick labels. The primary axis also sets the number of horizontal grid lines.
- Default
5
formatLargeNumbers?boolean
Abbreviate values of 1000 and above as thousands, with one decimal where needed, for example 2k or 1.5k.
- Default
true
formatValue?(value: number) => string
Formats a tick value into its label. Overrides formatLargeNumbers.
- Type
(value: number) => string
ChartTooltip
showDatePill?boolean
Show the date pill that rides along the bottom of the plot.
- Default
true
showCrosshair?boolean
Show the vertical crosshair line. Bar charts leave it off unless this is true (the dots and the category pill mark the bar).
- Default
true
showDots?boolean
Show a dot on every series at the hovered position.
- Default
true
dotVariant?"dot" | "ring"
Dot style: a filled "dot" or a transparent "ring" square. Read by BarChart only.
- Type
"dot" | "ring"- Default
"dot"
dotSize?number
Dot radius in px.
- Default
5
dotRadiusFraction?number
Corner radius of the "ring" variant as a fraction of its side (0 is square, 0.5 is a circle). Read by BarChart only.
- Default
0.25
dotScale?number
Multiplier applied to the dot or ring size. Read by BarChart and LiveLineChart.
- Default
1
dotStrokeWidth?number
Stroke width of the dots in px.
- Default
2
indicatorColor?string | ((point: Record<string, unknown>) => string)
Color of the crosshair. Only a string is applied; the function form that bklit-ui accepts is ignored and the default is used.
- Type
string | ((point: Record<string, unknown>) => string)- Default
"var(--chart-crosshair)"
content?(props: { point: Record<string, unknown>; index: number; pinned?: boolean; dismiss?: () => void }) => ReactNode
Replaces the default tooltip panel body. Receives the hovered data row and its index; with pinnable, also whether the panel is pinned and a dismiss that unpins it (for a close button in a pinned panel's detail).
- Type
(props: { point: Record<string, unknown>; index: number; pinned?: boolean; dismiss?: () => void }) => ReactNode
pinnable?boolean
A click (or Enter, or Space) on the chart pins the tooltip where it is: the panel takes the pointer, so its content can grow into detail and hold controls, until another click, Escape or dismiss lets it go.
- Default
false
rows?(point: Record<string, unknown>) => { readonly color: string; readonly label: string; readonly value: string | number }[]
Replaces the default rows (one per series) with your own list of { color, label, value }.
- Type
(point: Record<string, unknown>) => { readonly color: string; readonly label: string; readonly value: string | number }[]
dotColor?string | ((point: Record<string, unknown>, line: ChartLineConfig) => string)
Fill of the tooltip dots. A function receives the hovered row and the series config, and is called again each time the hovered row changes. Defaults to each series' color; a ProfitLossLine's dot takes the color of the hovered value's sign.
- Type
string | ((point: Record<string, unknown>, line: ChartLineConfig) => string)
children?ReactNode
Extra content rendered below the rows in the default panel, for example marker details. Without it, a chart with ChartMarkers lists the markers on the hovered date there.
class?string
Extra class name for the tooltip panel.
springConfig?SpringConfig
Spring for the floating panel when matchCrosshair is on. Defaults to the chart's tooltip spring.
matchCrosshair?boolean
Make the floating panel follow the pointer with the same spring as the crosshair instead of damping.
- Default
false
damping?number
Spring damping for the floating panel when matchCrosshair is off, on bklit's 0 to 100 scale: lower is bouncier, higher slower, 0 moves the panel instantly. The default, 20, is the snappy hover spring (stiffness 3600, damping 120); every other value is bklit's spring for it played six times faster.
- Default
20
indicatorDasharray?string
Dash pattern of the crosshair. Omit for a solid line.
indicatorFadeEdges?IndicatorFadeEdges
Vertical fade of the crosshair: both ends, the top, the bottom, or none (solid).
- Default
"both"
indicatorFadeLength?number
Size of the crosshair's fade, as a percentage of its height (2 to 40).
- Default
10
indicatorEndColor?string
Bottom colour of the crosshair: it ramps from indicatorColor at the top to this at the bottom (composes with the fade).
indicatorEnd?"plot" | "point"
How far down the crosshair reaches: the whole plot, or down to the hovered point of the first series.
- Type
"plot" | "point"- Default
"plot"
dotHaloBlur?number
Blur in px on the dots' halo, for a soft glow.
- Default
0
topOffset?number
Extra gap in px between the top of the plot and the tooltip panel.
- Default
0
dateLabels?readonly string[]
The date pill's text for each data row, in row order (pair it with XAxis labels).
boxSpringConfig?SpringConfig
Spring for the floating panel. Takes priority over matchCrosshair and damping.
indicatorWidth?IndicatorWidth
Thickness of the crosshair: a width in px, or "line" (1px), "thin" (2px), "medium" (4px) or "thick" (8px).
- Default
"line"
ErrorBarChartLoading
margin?Partial<ChartMargin>
Space around the plot in px. Missing sides use the chart's default.
- Type
Partial<ChartMargin>
aspectRatio?string | number
Aspect ratio of the placeholder, as "width / height" or a number.
- Type
string | number- Default
the chart's
label?string
Text shown centered over the skeleton, with a shimmer. Nothing is shown when it is unset or empty.
loadingLabel?string
Deprecated: Use label, the name every chart's placeholder takes..
class?string
Extra class name for the chart container.
RibbonChartLoading
margin?Partial<ChartMargin>
Space around the plot in px. Missing sides use the chart's default.
- Type
Partial<ChartMargin>
aspectRatio?string | number
Aspect ratio of the placeholder, as "width / height" or a number.
- Type
string | number- Default
the chart's
label?string
Text shown centered over the skeleton, with a shimmer. Nothing is shown when it is unset or empty.
loadingLabel?string
Deprecated: Use label, the name every chart's placeholder takes..
class?string
Extra class name for the chart container.
Examples
5 examples on Solid, each live with its code and its own install command.