shadcn.io is an independent project built on shadcn/ui
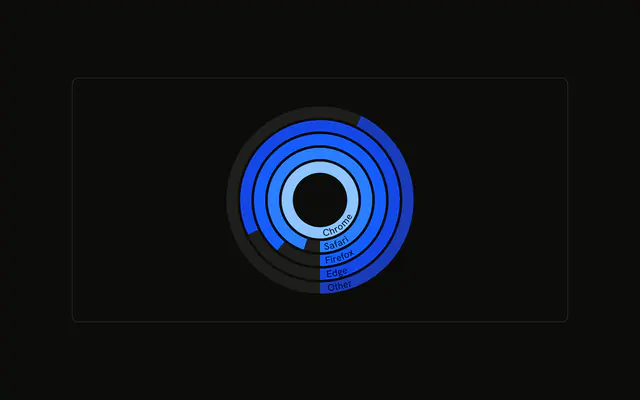
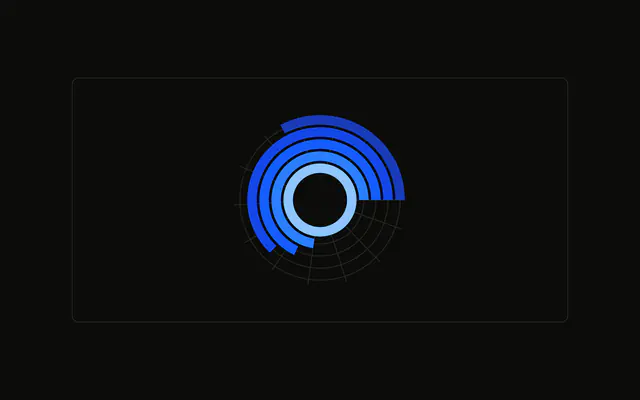
One ring per browser. The arc length follows the visitor count, over a muted track. The tooltip names the browser and the count.
Use radial bars to compare a few categories as rings. A normal bar chart is easier once the names get long. A Table is easier for the counts. In React, Ark UI maps each ring's color to a variable. You pass the visitor counts.
Installation
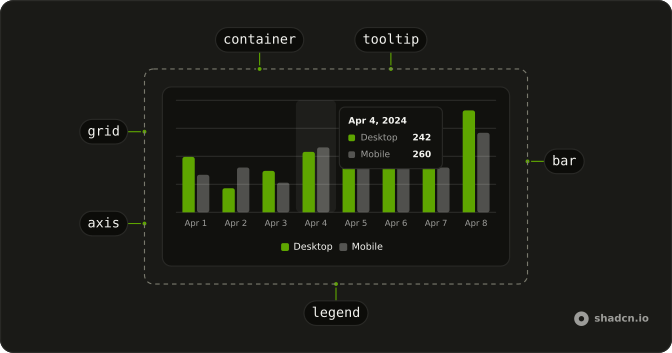
Anatomy
Usage
<div className="w-full max-w-xl rounded-md border bg-background p-4">
  <ChartContainer
    className="mx-auto aspect-square max-h-[250px]"
    config={chartConfig}
  >
    <RadialBarChart data={chartData} innerRadius={30} outerRadius={110}>
      <ChartTooltip content={renderTooltipContent} cursor={false} />
      <RadialBar background dataKey="visitors" />
    </RadialBarChart>
  </ChartContainer>
</div>
FAQ
How do I set the hole and the outer edge?
RadialBarChart sets innerRadius={30} and outerRadius={110}. The five browser rows share that band. Each row's visitors value is how far that arc runs. Chrome is 275 and Other is 90.
What does background draw?
RadialBar sets background and dataKey="visitors". background draws the full-circle track behind each arc, and the chart styles that sector with the muted fill. The colored part is the visitors value.
How does the tooltip name a ring?
ChartTooltipContent sets hideLabel and nameKey="browser". hideLabel drops the title. nameKey reads the row's browser field and looks it up in config, so the row says Chrome, Safari, Firefox, Edge, or Other. cursor={false} turns the hover cursor off.
Where does each ring's color come from?
Each chartData row sets fill to var(--color-chrome) or the matching key. config maps those keys to var(--chart-1) through var(--chart-5), and ChartContainer writes the --color- variables. visitors in config is only the label Visitors.
API Reference
Chart
Sets config={chartConfig}, content={renderTooltipContent} and cursor={false}. The rest is on the Chart page.