shadcn.io is an independent project built on shadcn/ui
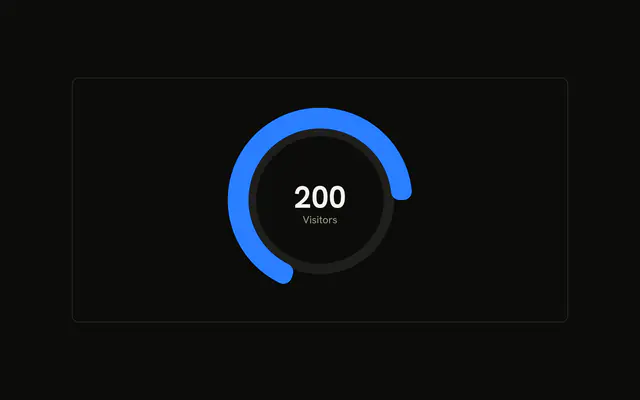
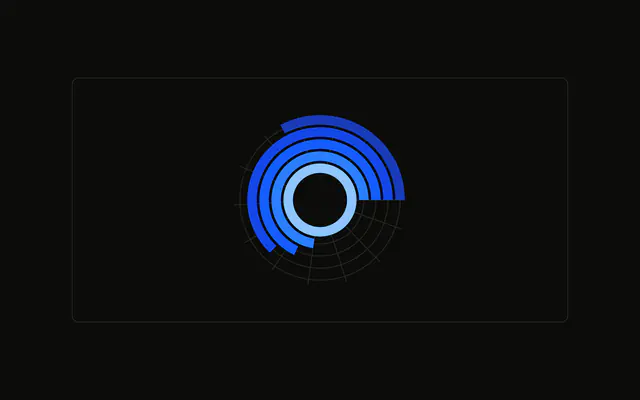
One arc covering a hundred degrees, on a muted track. Two plain circles sit inside it. The center shows the visitor count and the word Visitors.
Use it as a gauge for one number, when a full ring would overstate the scale. For a simple percent, a Progress bar is enough. In React, Ark UI does not draw the inner circles or the center text. You pass the one value.
Installation
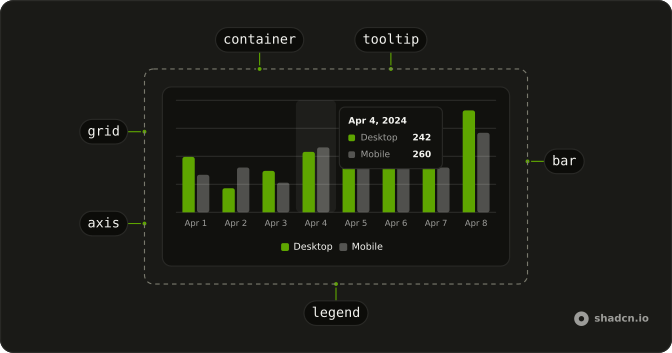
Anatomy
Usage
<div className="w-full max-w-xl rounded-md border bg-background p-4">
  <ChartContainer
    className="mx-auto aspect-square max-h-[250px]"
    config={chartConfig}
  >
    <RadialBarChart
      data={chartData}
      endAngle={100}
      innerRadius={80}
      outerRadius={140}
    >
      <PolarGrid
        className="first:fill-muted last:fill-background"
        gridType="circle"
        polarRadius={[86, 74]}
        radialLines={false}
        stroke="none"
      />
      <RadialBar background dataKey="visitors" />
      <PolarRadiusAxis axisLine={false} tick={false} tickLine={false}>
        <Label content={renderValue} />
      </PolarRadiusAxis>
    </RadialBarChart>
  </ChartContainer>
</div>
FAQ
How do I make the ring a short arc?
RadialBarChart sets endAngle={100} and leaves startAngle at its default, 0, which is the right side of the circle. The bar runs 100 degrees from there. innerRadius={80} and outerRadius={140} set the band.
How does the center get its number?
PolarRadiusAxis hides its axis with axisLine={false}, tick={false}, and tickLine={false}, and renders a Label whose content is renderValue. That function reads viewBox.cx and viewBox.cy, then prints chartData[0].visitors with toLocaleString and the caption Visitors.
What are the two circles inside the arc?
PolarGrid sets gridType="circle", polarRadius={[86, 74]}, radialLines={false}, and stroke="none". The className fills the first circle with fill-muted and the last with fill-background. Those radii are decoration. They are not a second data series.
What does background on the bar do?
RadialBar sets background and dataKey="visitors". background draws the full track for the 100 degree span, and the chart styles that track with the muted fill. The colored arc is the visitors value, 1260.
API Reference
Chart
Sets config={chartConfig}. The rest is on the Chart page.