Sparkline Examples
15 sparklines: KPI tiles, a stat card, a table of plans, synced rows, negative bars, crosshair styles and a 48-service grid. Each on React, Vue, Svelte and Solid, drawn with TanStack Charts in your theme. Sparkline docs and API.
Every sparkline example
15 examples.
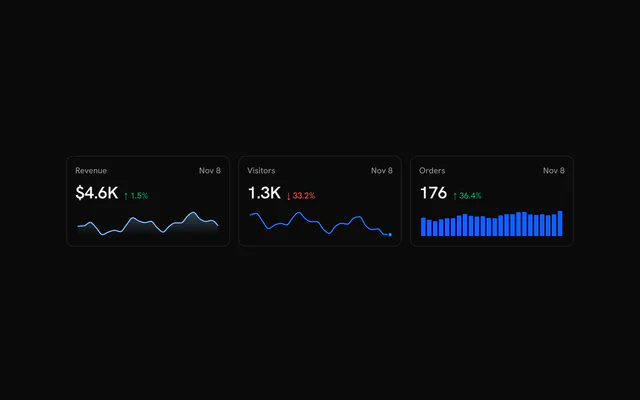
- SparklinesSparklineThree KPI tiles where hovering a day puts its value and change in the tile's figure.
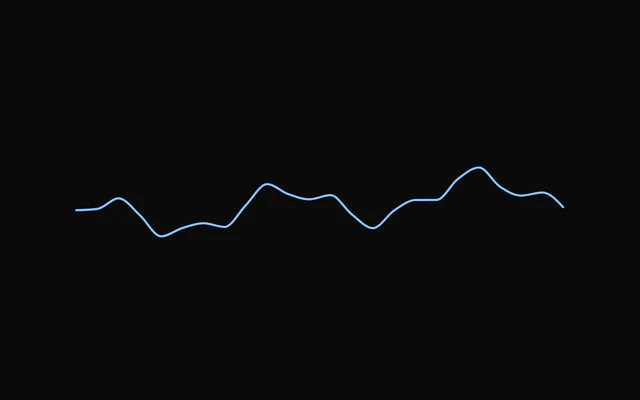
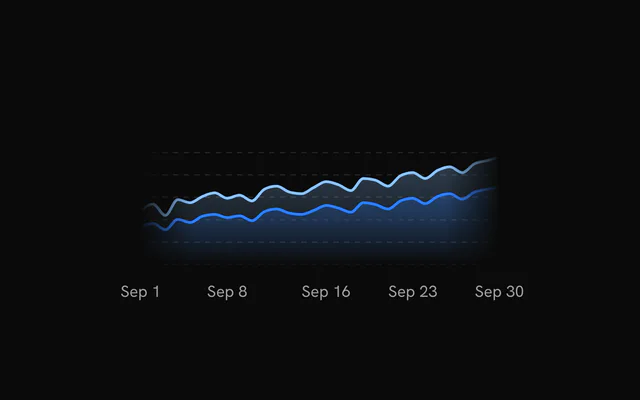
- Line SparklineSparklineDaily revenue as a line that dims on hover, except the segment around the hovered day.
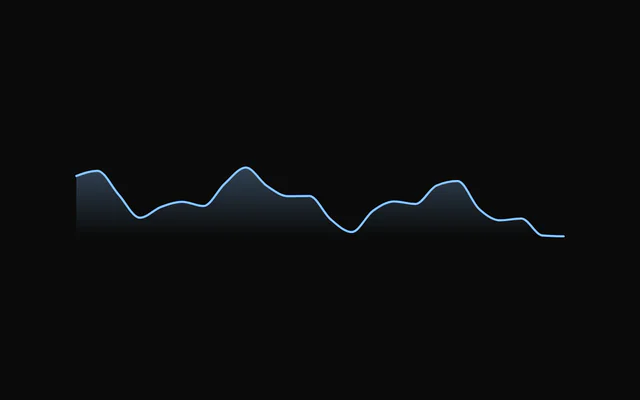
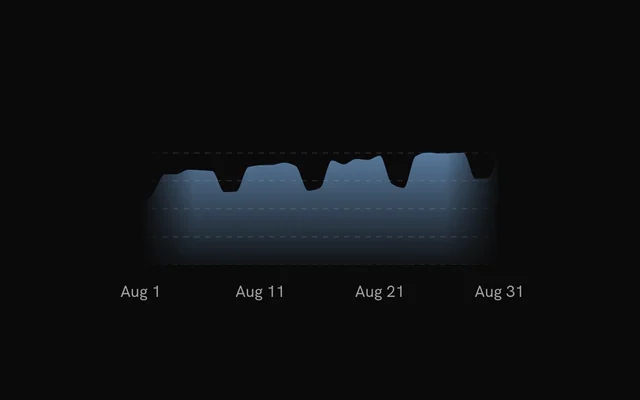
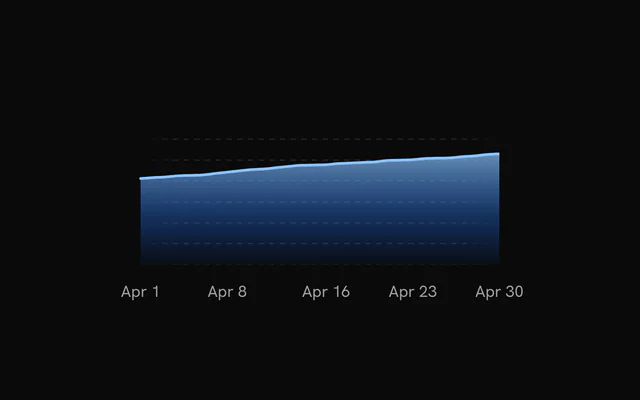
- Area SparklineSparklineDaily visitors over a gradient that fades to the baseline, wiped in from the left.
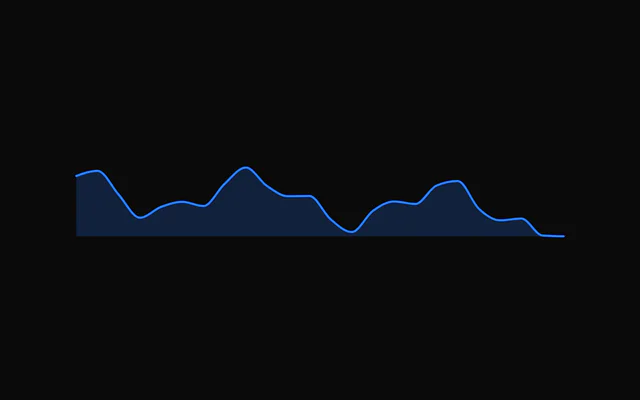
- Area Sparkline with a Solid FillSparklineOne flat tint under the line instead of a gradient, set with `fill`.
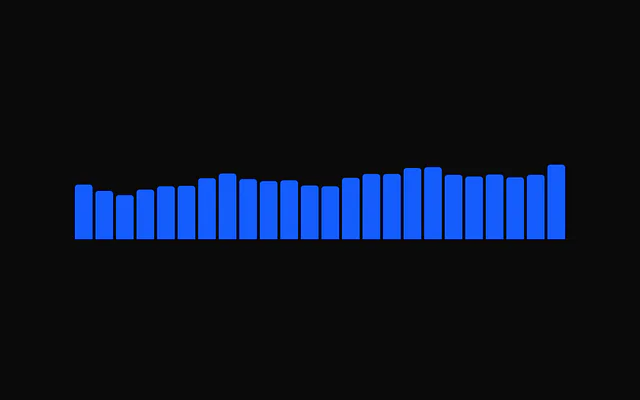
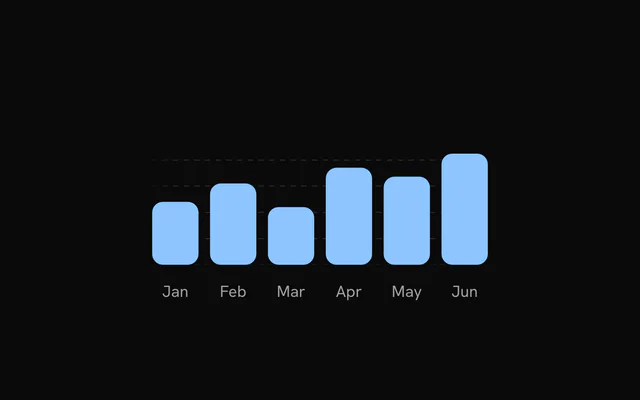
- Bar SparklineSparklineDaily orders as rounded bars, the hovered one at full strength and the rest faded.
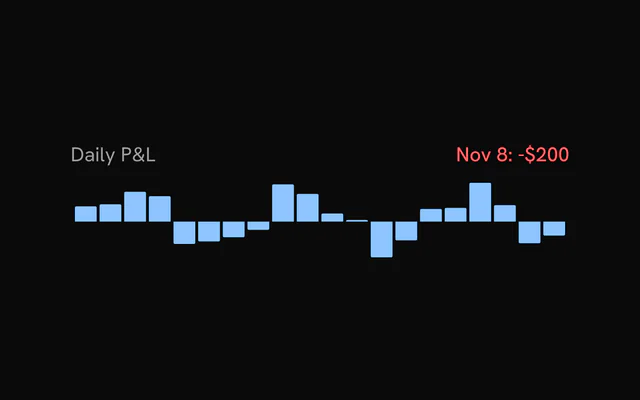
- Bar Sparkline with Negative ValuesSparklineProfit and loss by day as bars above and below zero, the hovered result shown in its color.
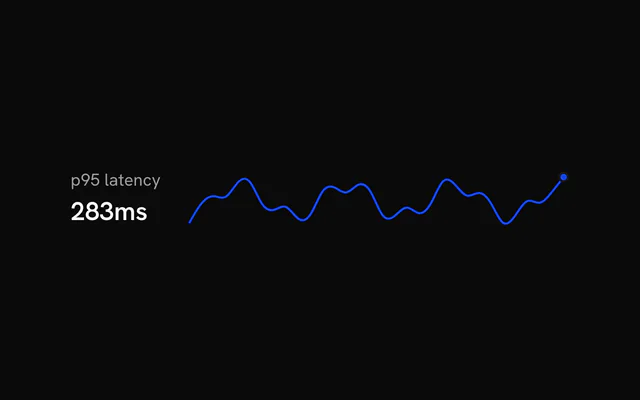
- Sparkline with an End DotSparklineA static latency line with a dot on the latest reading, next to the current figure.
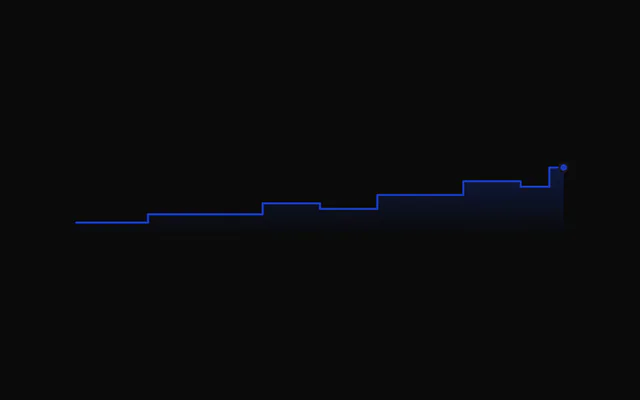
- Stepped Area SparklineSparklinePaid seats stepping up and down with each plan change, and a dot on the current count.
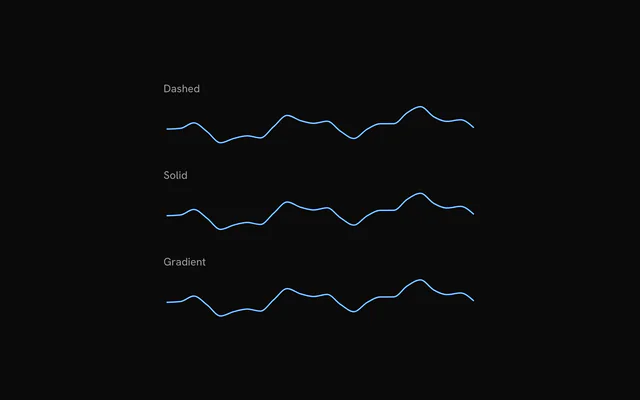
- Sparkline CrosshairsSparklineThe three crosshair styles side by side: dashed, solid and a gradient that fades at both ends.
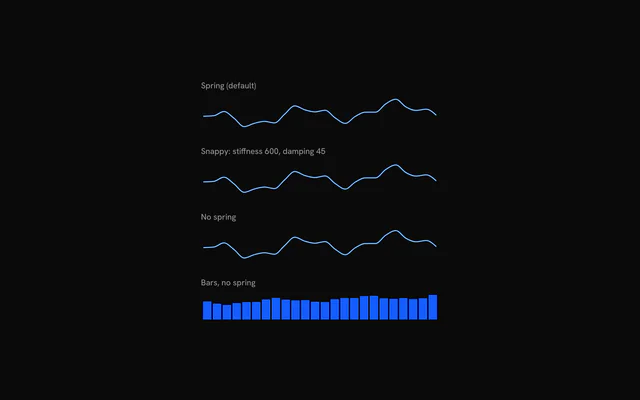
- Sparkline Hover SpringsSparklineCompare the default hover spring with a stiffer one and with no spring, on lines and on bars.
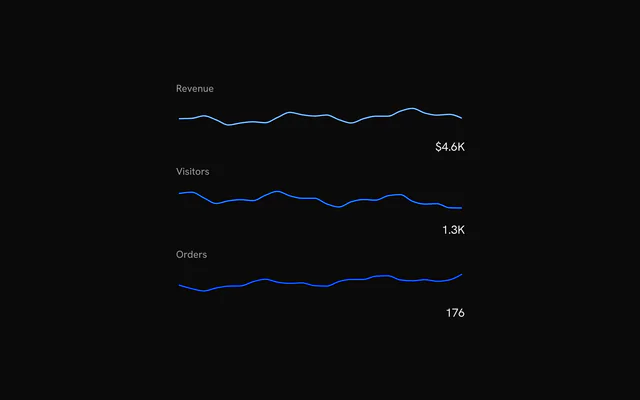
- Synced SparklinesSparklineThree metrics share one hovered index, so every crosshair and figure moves to the same day.
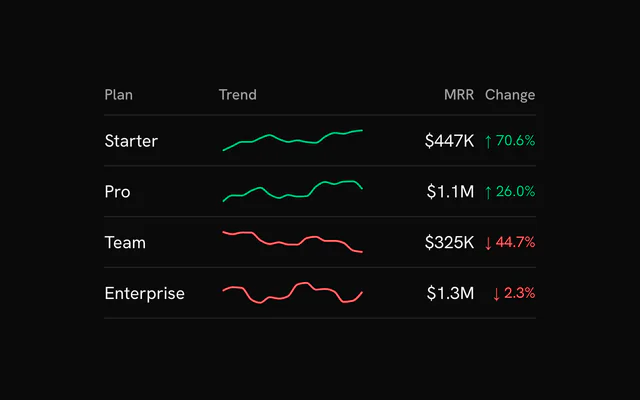
- Sparklines in a TableSparklineA 120 px sparkline in each plan's row, green when the plan grew and red when it shrank.
Or describe it. With Pro, your AI agent installs the sparkline example you describe, on your framework.
Get ProGalleries
More chart examples
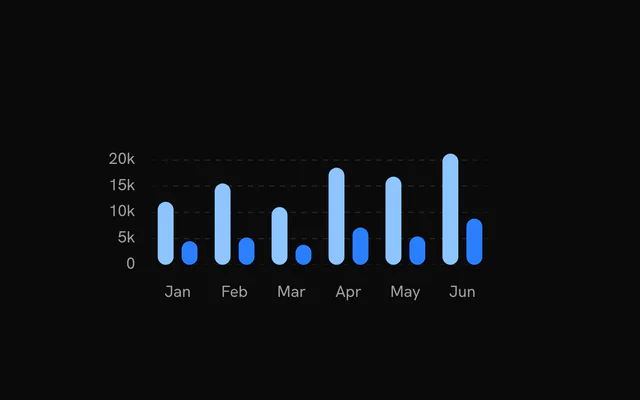
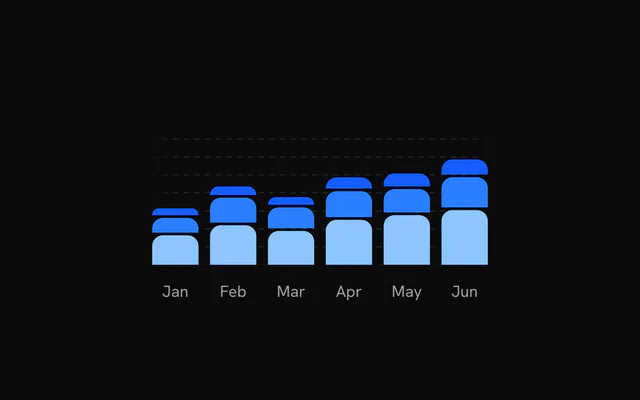
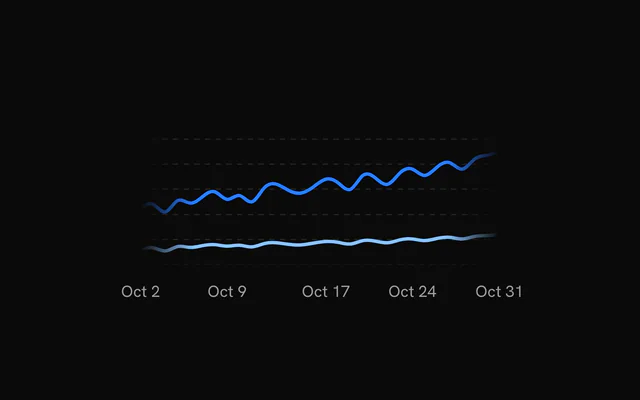
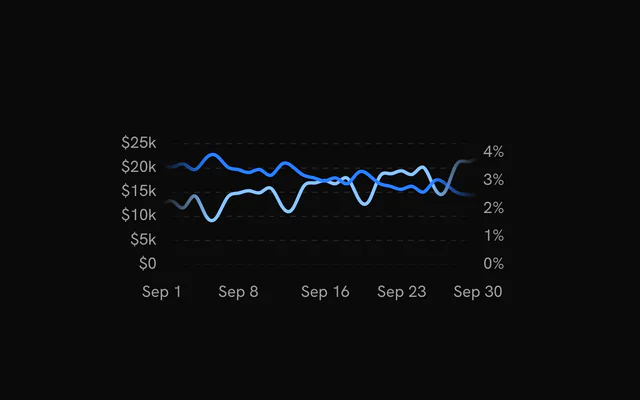
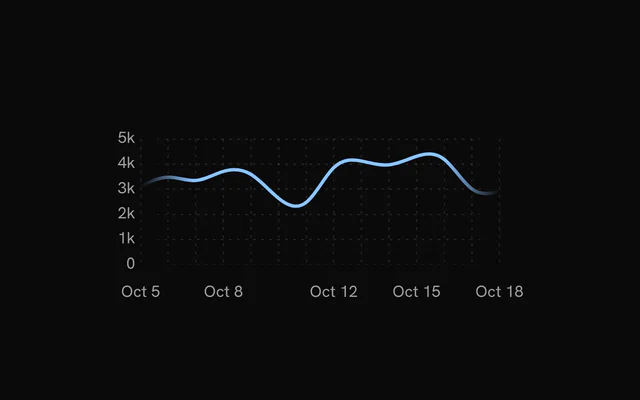
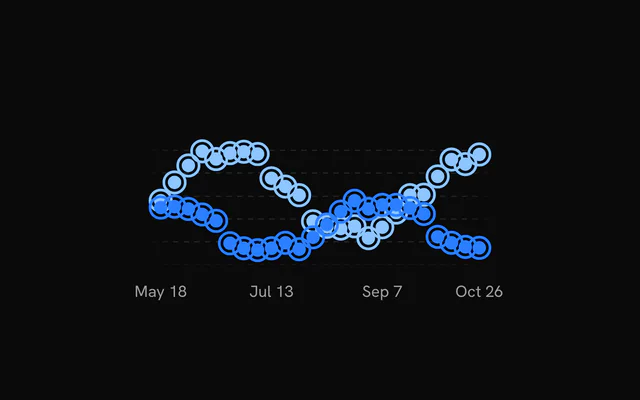
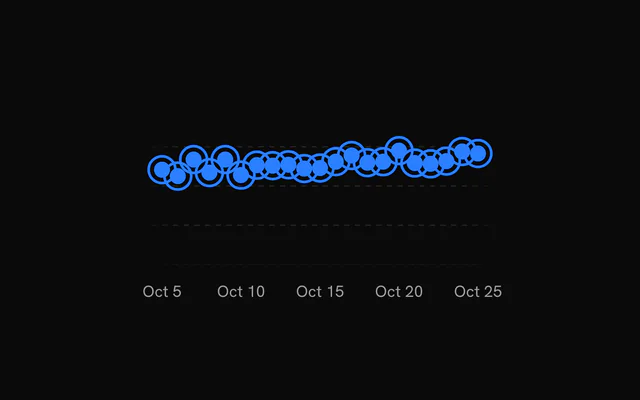
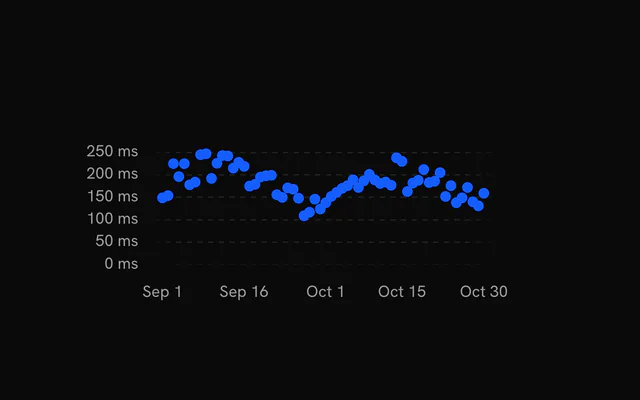
8 more chart types, free: open one for its examples and their code.
Pricing
Sparkline examples MCP, with Pro
Your AI agent installs any of the 1434 examples, and every component, block and icon, with every Pro plan.
4.9/5 out of 5 · 150+ reviewsfrom 150+ founders and developers.
- Secure checkout via Stripe
- Code lives in your repo
- Keep what you've shipped if you cancel
- License terms
FAQ
Frequently asked questions
15: Sparklines, Line Sparkline, Area Sparkline, Area Sparkline with a Solid Fill, Bar Sparkline, Bar Sparkline with Negative Values, Sparkline with an End Dot, Stepped Area Sparkline, Sparkline Crosshairs, Sparkline Hover Springs, Synced Sparklines, Sparklines in a Table, Sparkline Stat Card, Sparkline with a Range Toggle and Sparkline Grid. Each page has the live chart, its code and a one-line install.
Signed in, copy the chart's command: `npx shadcn@latest add` with its URL. It adds the chart to `components/charts`, the `chart-kit` kit every chart imports, and `@tanstack/charts`. Import the chart and render it.
Yes. Every chart is free to use in personal and commercial projects. Seeing the code and installing it takes a free account, one tap with Google or GitHub. Pro is the site's paid plan for blocks, the Pro collections and the MCP, and the charts don't need it.
4.9 out of 5 from 150+ developers


Every sparkline example. One prompt away.
Every sparkline example is free with an account. With Pro, your AI agent installs them from a prompt.
Get Pro