Area Chart Examples
20 area charts, from two translucent series to hatched fills, forecasts, target bands and small multiples on one scale. Each on React, Vue, Svelte and Solid, drawn with TanStack Charts in your theme. Area chart docs and API.
Every area chart example
20 examples.
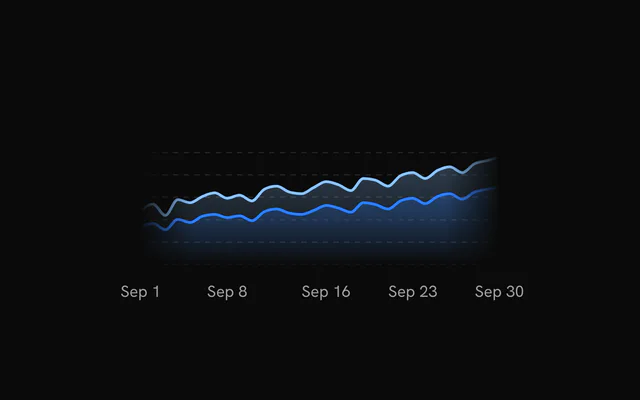
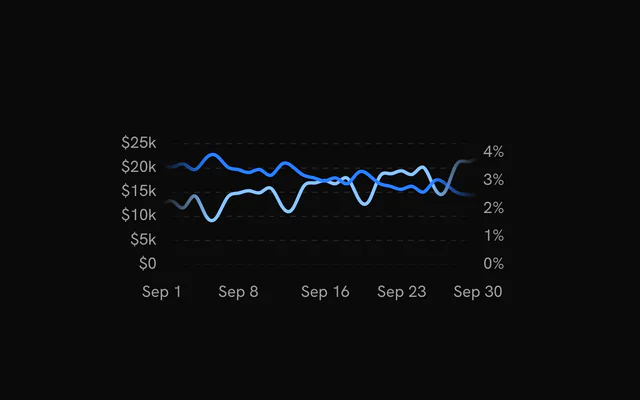
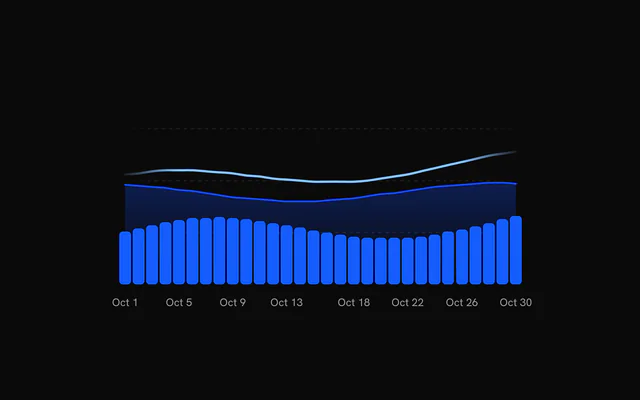
- Area ChartArea chartRevenue against costs over thirty days, two translucent fills with faded ends.
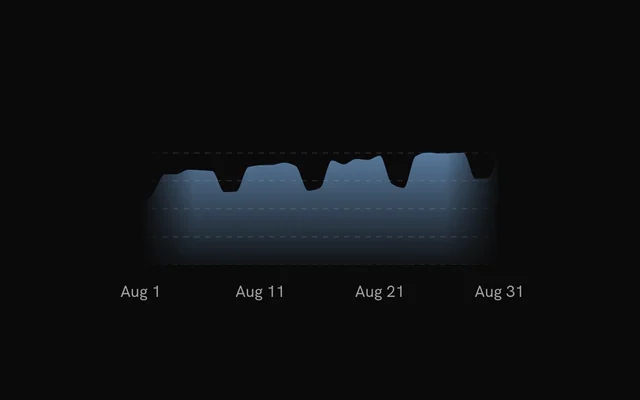
- Fill-Only Area ChartArea chartNo top line, just a denser fill that never quite fades out at the baseline.
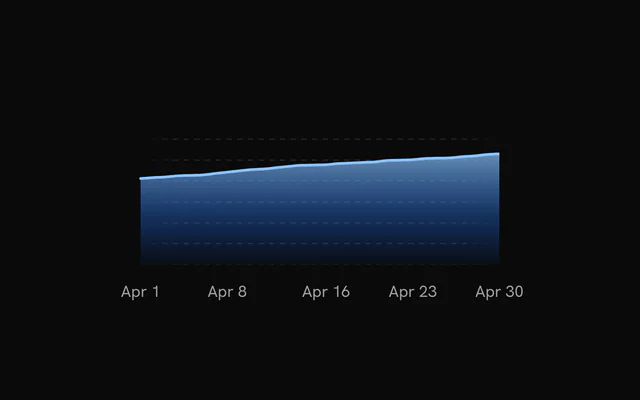
- Area Chart with Gradient FillArea chartA three-stop `LinearGradient` runs from `--chart-1` through `--chart-2` to `--chart-3` under one series.
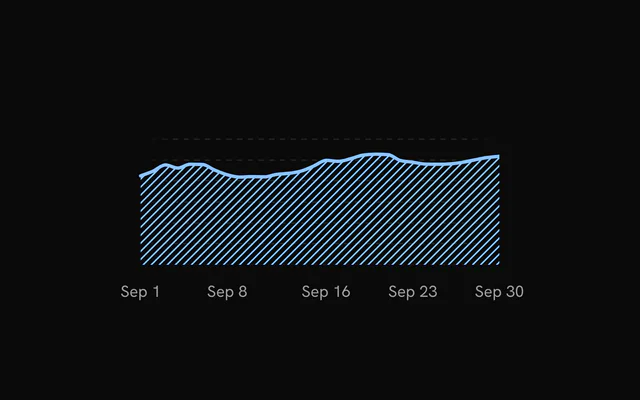
- Hatched Area ChartArea chartDiagonal hatching under a solid top line, from a `PatternArea` paired with a line-only `Area`.
- Area Chart with Mixed FillsArea chartDesktop as a gradient and mobile as dots, so two overlapping series stay easy to tell apart.
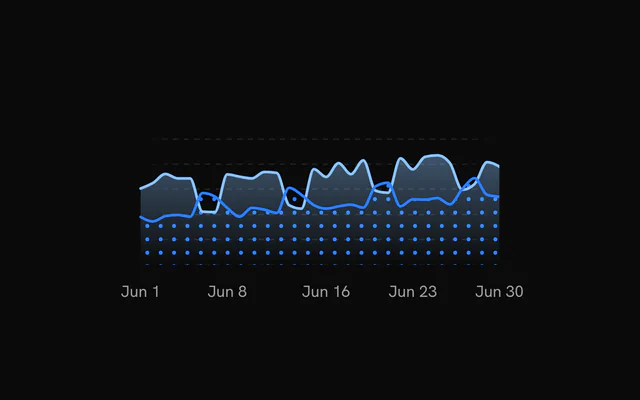
- Area Chart with ForecastArea chartThe line turns dashed after September, where actual revenue ends and the forecast takes over.
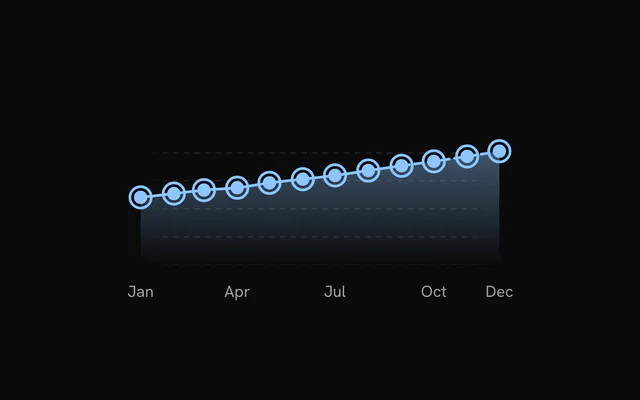
- Area Chart with a Target BandArea chartA dashed band marks the 180 to 240 sign-up target, so the two misses stand out.
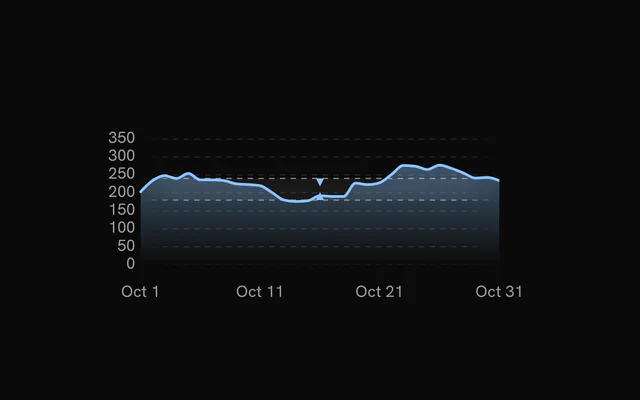
- Area Chart with Highlighted RangeArea chartLaunch week shaded between two solid edges, placed by date with `x1` and `x2`.
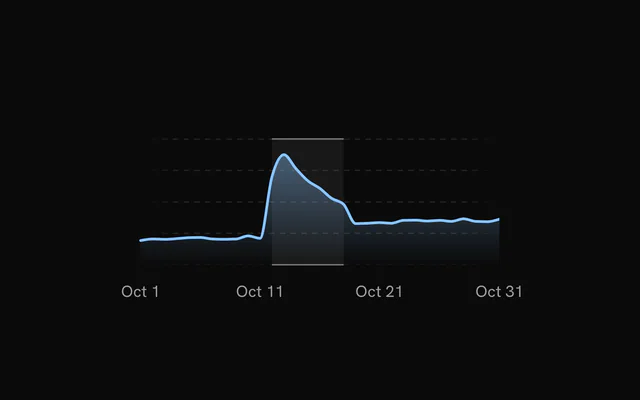
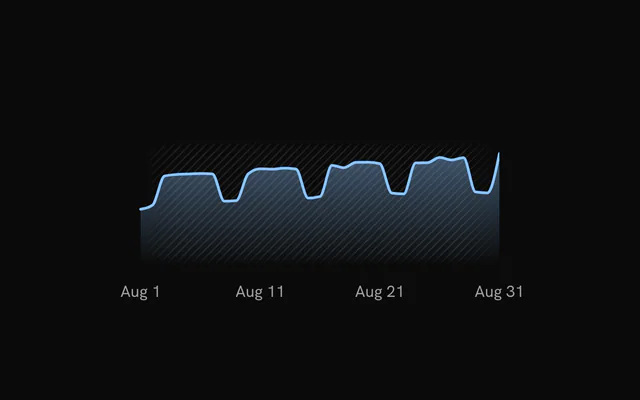
- Area Chart with Patterned BackgroundArea chartA diagonal pattern that fades toward the edges stands in for the grid lines.
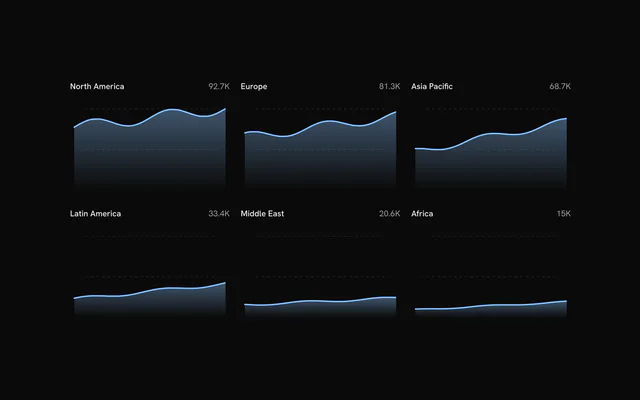
- Area Chart Small MultiplesArea chartSix regions on one shared y scale, and hovering any panel shows that week in all six.
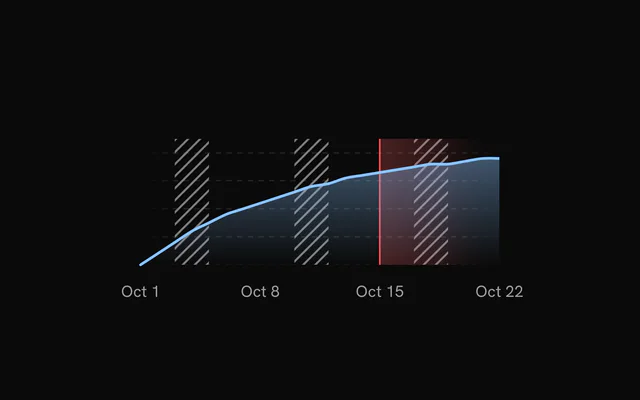
- Area Chart with Weekends and a DeadlineArea chartWeekends striped behind the issue count, and the days past the due date shaded red.
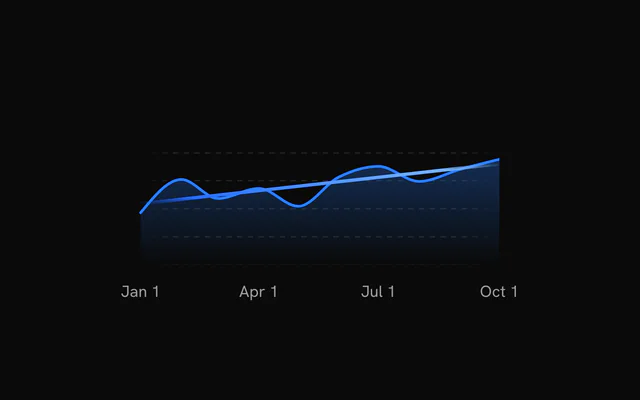
- Area Chart with Trend LineArea chartTen months of visits with a least-squares trend whose gradient stroke fades at both ends.
Or describe it. With Pro, your AI agent installs the area chart example you describe, on your framework.
Get ProGalleries
More chart examples
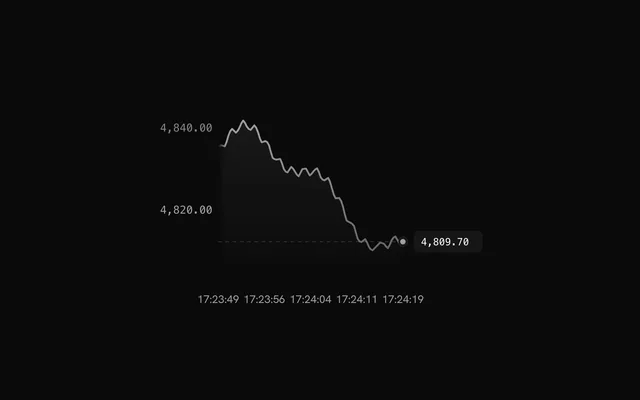
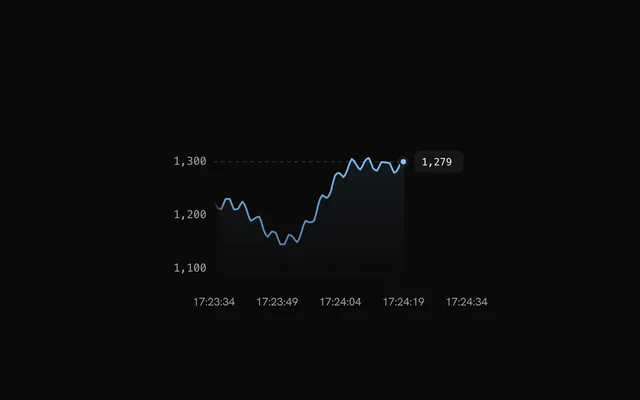
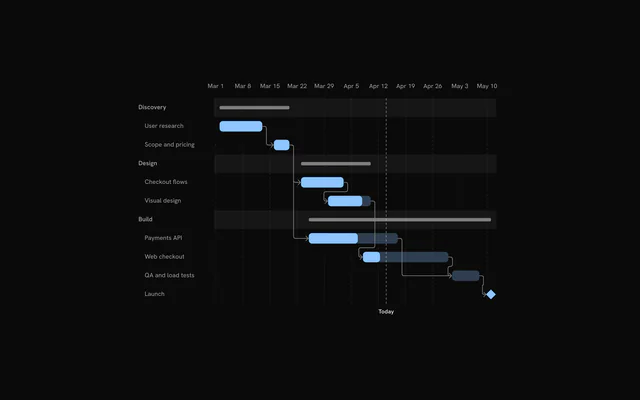
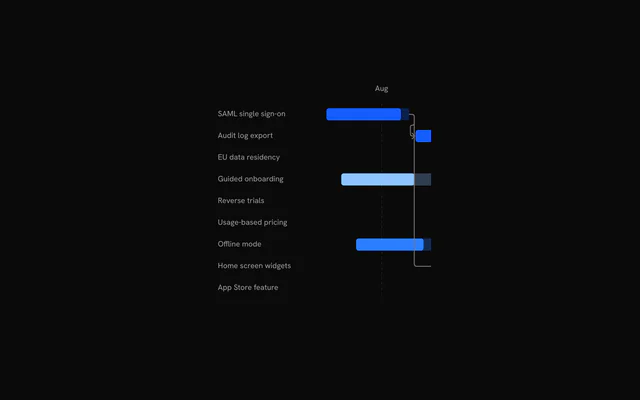
8 more chart types, free: open one for its examples and their code.
Pricing
Area Chart examples MCP, with Pro
Your AI agent installs any of the 1434 examples, and every component, block and icon, with every Pro plan.
4.9/5 out of 5 · 150+ reviewsfrom 150+ founders and developers.
- Secure checkout via Stripe
- Code lives in your repo
- Keep what you've shipped if you cancel
- License terms
FAQ
Frequently asked questions
20: Area Chart, Fill-Only Area Chart, Area Chart with Gradient Fill, Hatched Area Chart, Area Chart with Mixed Fills, Area Chart with Forecast, Area Chart with a Target Band, Area Chart with Highlighted Range, Area Chart with Patterned Background, Area Chart Small Multiples, Area Chart with Weekends and a Deadline, Area Chart with Trend Line, Area Chart with Value Labels, Area Chart with Dual Axis, Stepped Area Chart, Area Chart with Range Selection, Area Chart with Faded Pattern, Area Chart with Bottom Fade, Area Chart with Custom Labels and Area Chart Loading State. Each page has the live chart, its code and a one-line install.
Signed in, copy the chart's command: `npx shadcn@latest add` with its URL. It adds the chart to `components/charts`, the `chart-kit` kit every chart imports, and `@tanstack/charts`. Import the chart and render it.
Yes. Every chart is free to use in personal and commercial projects. Seeing the code and installing it takes a free account, one tap with Google or GitHub. Pro is the site's paid plan for blocks, the Pro collections and the MCP, and the charts don't need it.
4.9 out of 5 from 150+ developers


Every area chart example. One prompt away.
Every area chart example is free with an account. With Pro, your AI agent installs them from a prompt.
Get Pro