Globe Graph
A web app that charts country statistics such as GDP, population and life expectancy across many years.
- Category
- Apps & Platforms
- Added
About
About Globe Graph
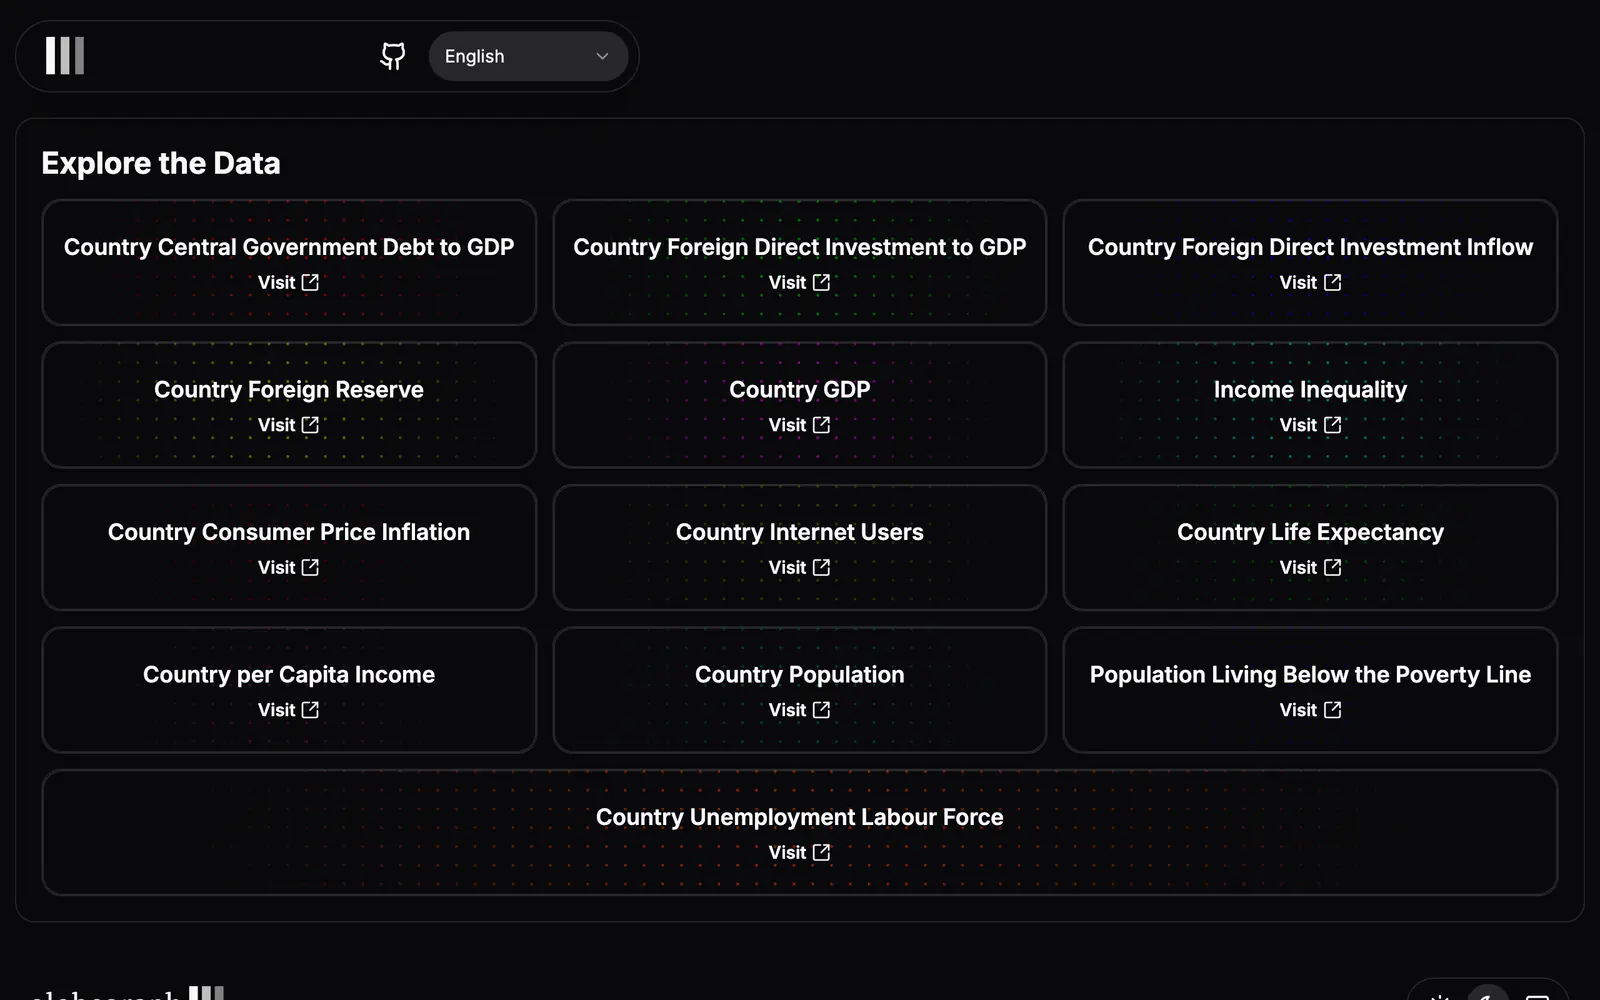
Globe Graph is a web app for exploring country statistics through charts. Its home page, titled Explore the Data, links to separate views for central government debt to GDP, foreign direct investment, foreign reserves, GDP, income inequality, consumer price inflation, internet users, life expectancy, income per capita, population, poverty rate and unemployment.
There is nothing to install: you open the hosted site and pick a topic. It is best treated as an example of a data-heavy charting app rather than a package. It suits students, journalists and developers looking for ideas on presenting statistics with charts in a shadcn/ui project.
Globe Graph features
5 features
- GDP and GDP per capita charts
- Population and life expectancy views
- Inflation, debt and unemployment topics
- Internet users and income inequality
- Data shown across different years
What you can build with Globe Graph
3 use cases
- Comparing GDP trends between countries for a report
- Checking life expectancy and population for a school project
- Finding inspiration for a statistics dashboard
Apps & Platforms
Similar to Globe Graph
More apps & platforms like Globe Graph: the closest by what they do, then the most starred.
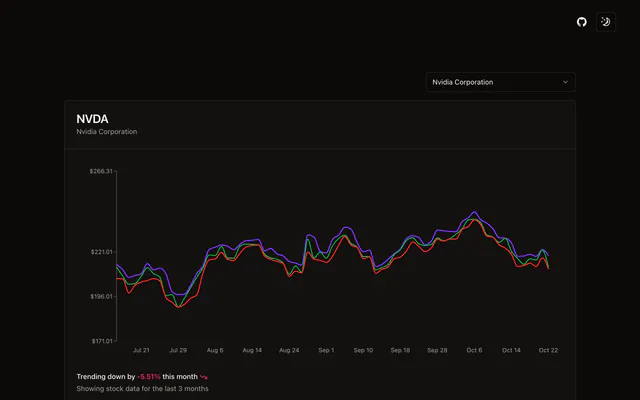
 Stock PickerAppStock Picker is a Next.js demo that picks a stock and plots three months of price history, using React Server Components and shadcn/ui charts.
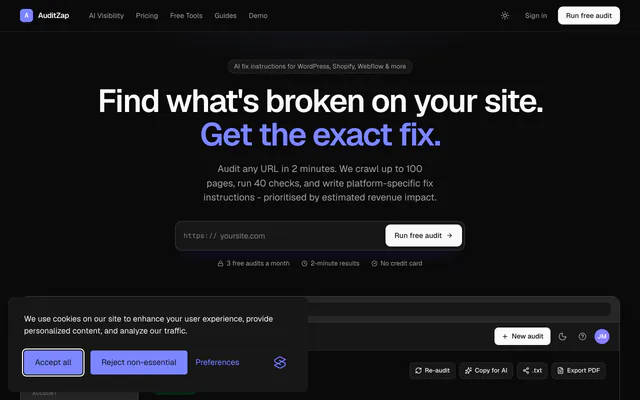
 AuditZapAppAuditZap crawls a site, runs SEO, performance and AI search checks, and writes platform-specific fixes ranked by estimated revenue impact.
 Vercel Status TrackerAppVercel Status Tracker lists the status of the projects deployed to your Vercel team, using your Team ID and API token. Built with Tailwind and shadcn/ui.
 Atomic CRMAppAtomic CRM is a free, MIT-licensed CRM from Marmelab with contacts, tasks, notes and a deals Kanban board, built on React, shadcn/ui and Supabase.
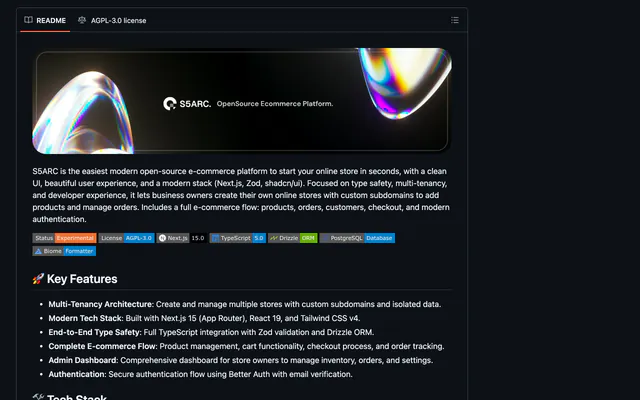
 S5ARCAppS5ARC is an AGPL-3.0 multi-tenant store builder on Next.js, Drizzle ORM, Zod and Better Auth, with products, checkout, orders and an admin dashboard.
 CodeOtterAppCodeOtter is an AGPL-3.0, self-hosted AI PR review platform that scores each diff on six gauges and nine merge gates, with no per-seat billing.

Pricing
Ship it with Pro
The directory is free. Pro adds 6,000+ blocks, 14 premium templates and the MCP server, so your AI editor installs them for you.
4.9/5 out of 5 · 150+ reviewsfrom 150+ founders and developers.
- Secure checkout via Stripe
- Code lives in your repo
- Keep what you've shipped if you cancel
- License terms
FAQ
Frequently asked questions
What Globe Graph is, how to install it, its license and its alternatives.
A web app that charts country statistics such as GDP, population and life expectancy across many years.
Globe Graph lists GDP and GDP per capita charts, Population and life expectancy views, Inflation, debt and unemployment topics, Internet users and income inequality and Data shown across different years.
The directory lists these uses for Globe Graph: Comparing GDP trends between countries for a report, Checking life expectancy and population for a school project and Finding inspiration for a statistics dashboard.
The directory does not name a maker for Globe Graph. Its site is https://globe-graph.vercel.app/.
Globe Graph was added to the directory on December 27, 2024.
Globe Graph is in Apps & Platforms. Apps and products built with shadcn/ui, from CRMs and kanban boards to AI search engines, many open source to study or run yourself.
Charts, Dashboard and Analytics. Each tag has a page listing the other resources that carry it.
Yes. Globe Graph's page has a Live tab beside the screenshot that loads its site in a frame.
The directory lists no install command for Globe Graph. Follow the instructions on its site at https://globe-graph.vercel.app/.
The directory lists no shadcn CLI command for Globe Graph. Check its docs at https://globe-graph.vercel.app/ for how to add it.
The directory links no repository for Globe Graph. Its site is https://globe-graph.vercel.app/.
The directory links no separate docs for Globe Graph; start from its site at https://globe-graph.vercel.app/.
The directory records no license for Globe Graph. Check its repository or site before you use it.
The directory records no price for Globe Graph. Its site, https://globe-graph.vercel.app/, is where its pricing, if any, is stated.
No. Globe Graph is made by its own maker and listed here as a link. A shadcn.io Pro plan covers shadcn.io's own blocks, templates and tools.
Other resources in Apps & Platforms, newest first: Stock Picker, AuditZap, Vercel Status Tracker and Atomic CRM. Their pages are linked under Similar to Globe Graph.
Open its category, Apps & Platforms, or one of its tags (Charts, Dashboard and Analytics): each page lists the resources that share it.
4.9 out of 5 from 150+ developers


Found your stack? Ship it.
6,000+ blocks, premium templates and MCP in every Pro plan. The directory stays free.
Get Pro