Zoomable Shadcn Chart
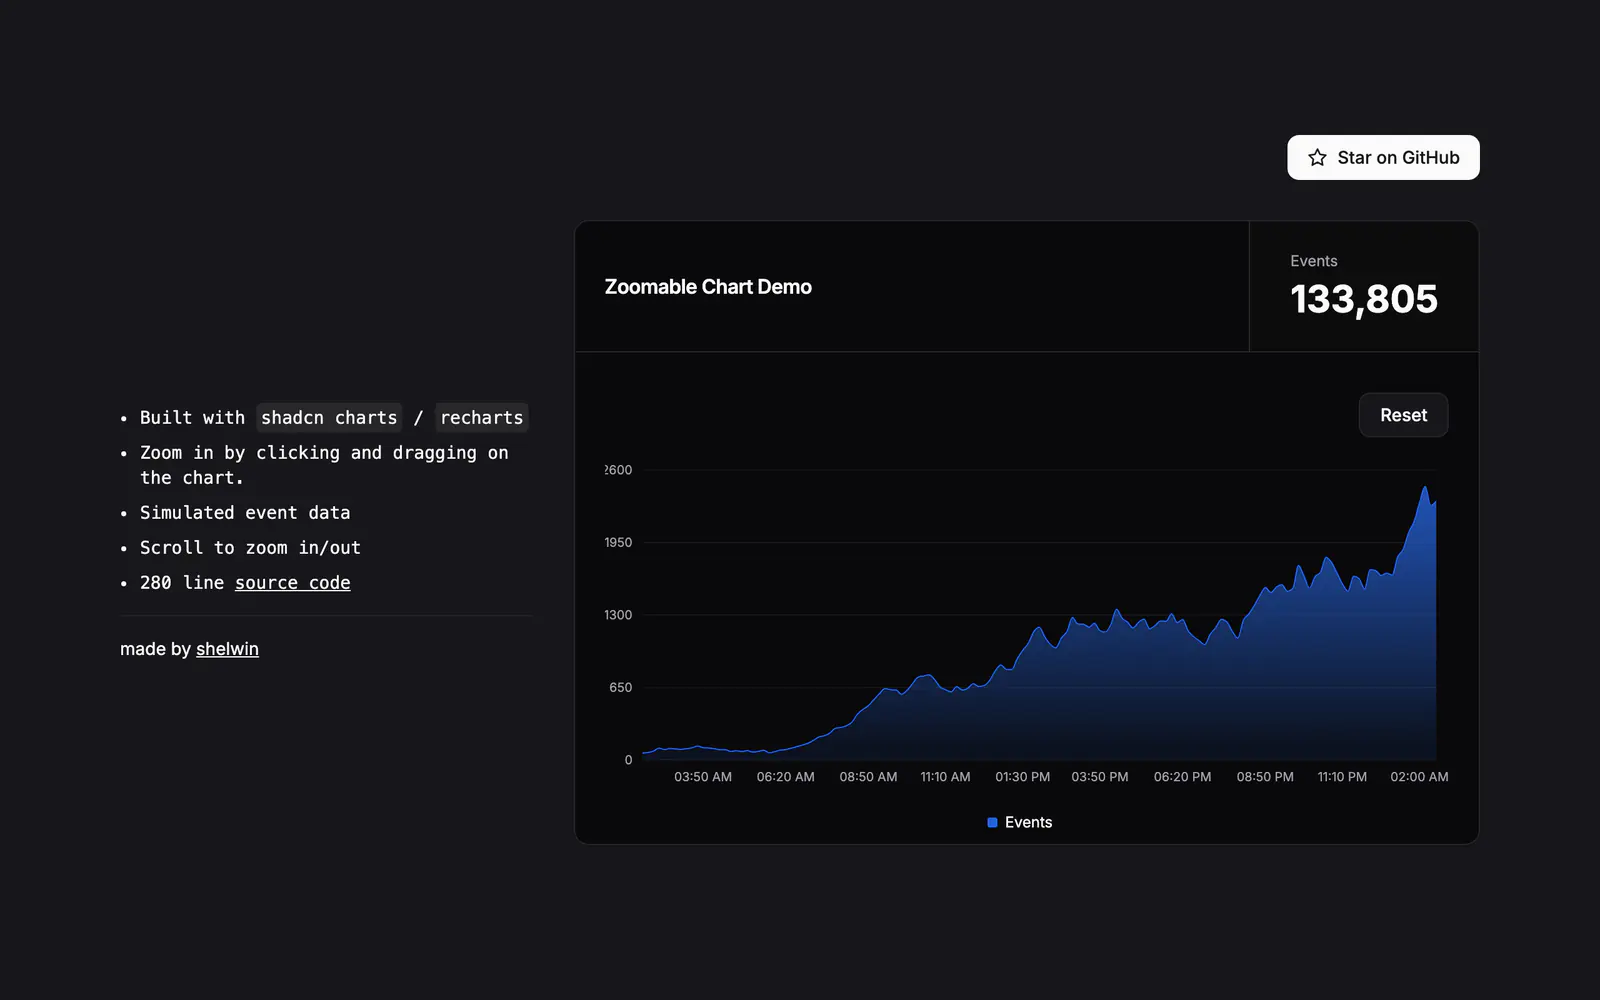
A drag-to-zoom line chart built with shadcn charts and Recharts, with its source in one file.
- Category
- Libraries & Components
- Added
- GitHub stars
- 630
- License
- MIT
- Price
- Free
About
About Zoomable Shadcn Chart
This repository shows how to make a shadcn/ui chart zoomable. The demo draws a line chart of simulated event data on top of shadcn charts and Recharts. You zoom by clicking and dragging across the area you want, or by scrolling, and a Reset button returns to the full range.
The chart lives in components/chart.tsx, which the site describes as about 280 lines of source. To try it, clone the repository, install dependencies and start the dev server. It is MIT licensed, and fits developers who want to study the zoom logic or lift it into a dashboard that already uses shadcn charts.
Zoomable Shadcn Chart features
5 features
- Click and drag to zoom into a range
- Scroll to zoom in and out
- Reset button to restore the full view
- Built on shadcn charts and Recharts
- Chart code in a single component file
Install Zoomable Shadcn Chart
1 command
Terminal
$ git clone git@github.com:shelwinsunga/zoom-chart-demo.gitWhat you can build with Zoomable Shadcn Chart
3 use cases
- Letting users inspect a spike in an event timeline
- Adding zoom to a time-series chart in an analytics dashboard
- Learning how to extend shadcn charts with custom interaction
Libraries & Components
Similar to Zoomable Shadcn Chart
More libraries & components like Zoomable Shadcn Chart: the closest by what they do, then the most starred.
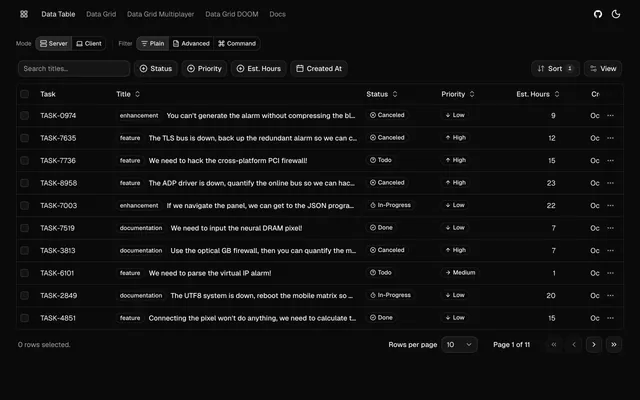
 tablecnLibrarytablecn is an open-source data table and grid built on shadcn/ui, with sorting, filtering, pagination, infinite scroll and live collaboration.
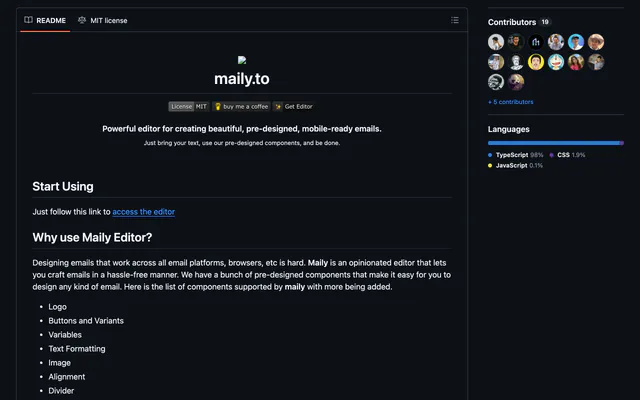
 MailyLibraryMaily is an MIT-licensed email editor for React. Drop in prebuilt blocks like buttons, columns and variables, and ship mobile-ready emails.
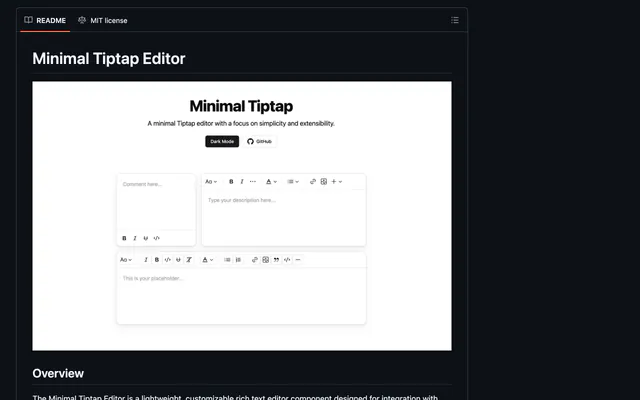
 Minimal TiptapLibraryMinimal Tiptap is a customizable rich text editor for shadcn/ui projects, with image upload, code blocks, tables and HTML, JSON or Markdown output.
 Indie UILibraryIndie UI is a free, MIT-licensed collection of React and Tailwind CSS components with variants, dark mode support and TypeScript types for web apps.
 ogimagecnLibraryogimagecn gives React apps customizable Open Graph image components built on Satori, installed one at a time with the shadcn CLI.
 Commerce UILibraryCommerce UI has 100+ free storefront components and blocks for shadcn/ui: product cards, reviews, carts and promo banners, ready for Tailwind CSS v4.



Pricing
Ship it with Pro
The directory is free. Pro adds 6,000+ blocks, 14 premium templates and the MCP server, so your AI editor installs them for you.
4.9/5 out of 5 · 150+ reviewsfrom 150+ founders and developers.
- Secure checkout via Stripe
- Code lives in your repo
- Keep what you've shipped if you cancel
- License terms
FAQ
Frequently asked questions
What Zoomable Shadcn Chart is, how to install it, its license and its alternatives.
Clone the repository, run npm install and then npm run dev, and open localhost:3000. The chart code is in components/chart.tsx.
It is a demo repository to clone, not a published package or registry item. You copy the chart component into your own project.
A drag-to-zoom line chart built with shadcn charts and Recharts, with its source in one file.
Zoomable Shadcn Chart lists Click and drag to zoom into a range, Scroll to zoom in and out, Reset button to restore the full view, Built on shadcn charts and Recharts and Chart code in a single component file.
The directory lists these uses for Zoomable Shadcn Chart: Letting users inspect a spike in an event timeline, Adding zoom to a time-series chart in an analytics dashboard and Learning how to extend shadcn charts with custom interaction.
Zoomable Shadcn Chart is made by shelwinsunga, at https://github.com/shelwinsunga. Its site is https://github.com/shelwinsunga/zoom-chart-demo.
Zoomable Shadcn Chart was added to the directory on December 27, 2024.
Zoomable Shadcn Chart is in Libraries & Components. Component libraries and standalone components built on shadcn/ui, covering the data tables, pickers, editors and charts the core set leaves out.
Charts, Components, React, Open source, MIT and Free. Each tag has a page listing the other resources that carry it.
Yes. Zoomable Shadcn Chart's page has a Live tab beside the screenshot that loads its site in a frame.
Zoomable Shadcn Chart lists this command: `git clone git@github.com:shelwinsunga/zoom-chart-demo.git`.
The directory lists no shadcn CLI command for Zoomable Shadcn Chart. Check its docs at https://github.com/shelwinsunga/zoom-chart-demo for how to add it.
Zoomable Shadcn Chart's repository is https://github.com/shelwinsunga/zoom-chart-demo.
The directory links no separate docs for Zoomable Shadcn Chart; start from its site at https://github.com/shelwinsunga/zoom-chart-demo.
GitHub lists Zoomable Shadcn Chart under the MIT license. Read the license file in its repository for the terms.
The directory records no price for Zoomable Shadcn Chart. Its site, https://github.com/shelwinsunga/zoom-chart-demo, is where its pricing, if any, is stated.
No. Zoomable Shadcn Chart is made by shelwinsunga and listed here as a link. A shadcn.io Pro plan covers shadcn.io's own blocks, templates and tools.
Other resources in Libraries & Components, newest first: tablecn, Maily, Minimal Tiptap and Indie UI. Their pages are linked under Similar to Zoomable Shadcn Chart.
Open its category, Libraries & Components, or one of its tags (Charts, Components and React): each page lists the resources that share it.
4.9 out of 5 from 150+ developers


Found your stack? Ship it.
6,000+ blocks, premium templates and MCP in every Pro plan. The directory stays free.
Get Pro