shadcn.io is an independent project built on shadcn/ui
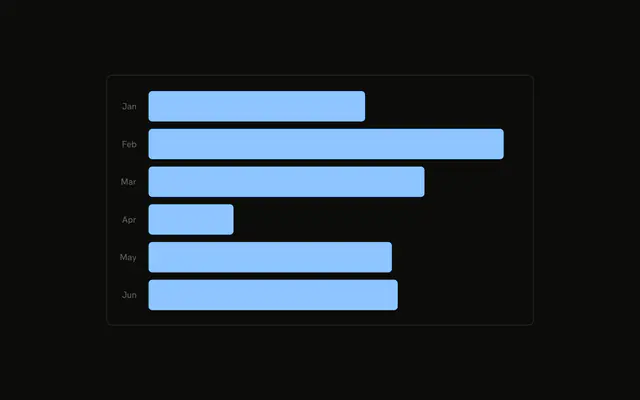
Horizontal bars for six months of desktop visitors. January and the other full names sit inside the start of each bar, and the count sits just past the end. Both axes are hidden.
Use it when the names must be readable on a slide or in a report, without a hover. Extra columns belong in a Table. In React, Base UI does not write the month or the value. Both come from the row.
Installation
Anatomy
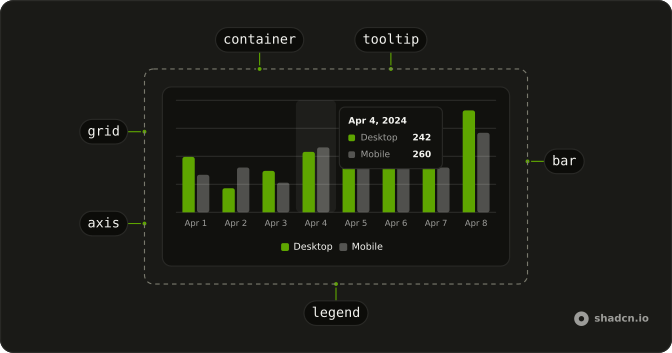
Usage
<div className="w-full max-w-xl rounded-md border bg-background p-4">
  <ChartContainer config={chartConfig}>
    <BarChart
      accessibilityLayer
      data={chartData}
      layout="vertical"
      margin={{
        right: 16,
      }}
    >
      <CartesianGrid horizontal={false} />
      <YAxis
        axisLine={false}
        dataKey="month"
        hide
        tickFormatter={formatMonth}
        tickLine={false}
        tickMargin={10}
        type="category"
      />
      <XAxis dataKey="desktop" hide type="number" />
      <ChartTooltip
        content={<ChartTooltipContent indicator="line" />}
        cursor={false}
      />
      <Bar dataKey="desktop" fill="var(--color-desktop)" radius={4}>
        <LabelList
          className="fill-(--color-label)"
          dataKey="month"
          fontSize={12}
          offset={8}
{/* The rest of the file is under Installation. */}
FAQ
How does the month name end up inside the bar?
The first LabelList uses dataKey month, position insideLeft, offset 8, and fontSize 12. Its className is fill-(--color-label). config sets that label color to var(--background), so the month matches the page background and reads on the bar.
How is the number placed at the end of the bar?
A second LabelList uses dataKey desktop, position right, the same offset and fontSize, and className fill-foreground. BarChart sets margin to { right: 16 } so those numbers stay inside the frame.
What makes the bars horizontal?
BarChart sets layout to vertical. YAxis is type category with dataKey month, and XAxis is type number with dataKey desktop. Both axes set hide.
Do the inside labels use the short month names?
No. The inside LabelList prints month with no formatter, so the text is January and the rest of the full names. formatMonth, which slices to three characters, is only passed to the hidden YAxis.
API Reference
Chart
Sets config={chartConfig} and indicator="line". The rest is on the Chart page.