Stream Chart Examples
3 stream charts, from a streamgraph of listening hours to weekly traffic as shares of 100%. Each on React, Vue, Svelte and Solid, drawn with TanStack Charts in your theme. Stream chart docs and API.
Every stream chart example
3 examples.
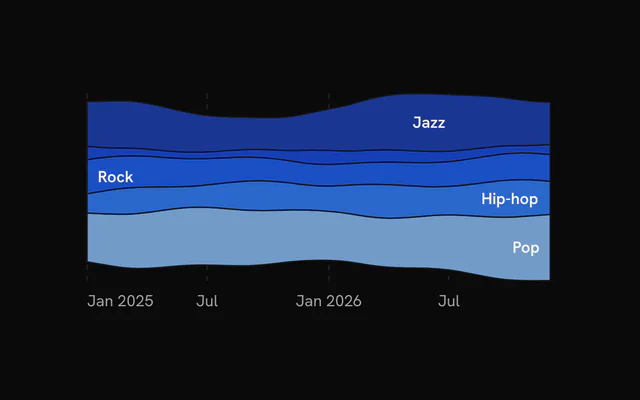
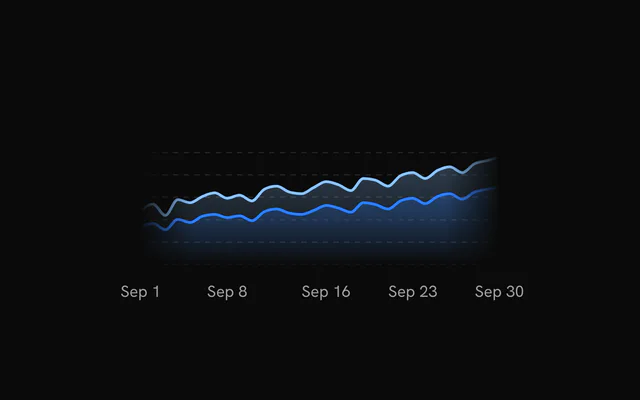
- Stream ChartStream chartFive genres over two years around a moving baseline, each named where its layer is thickest.
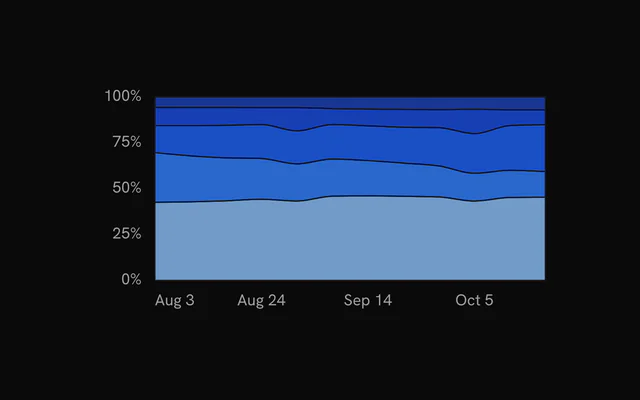
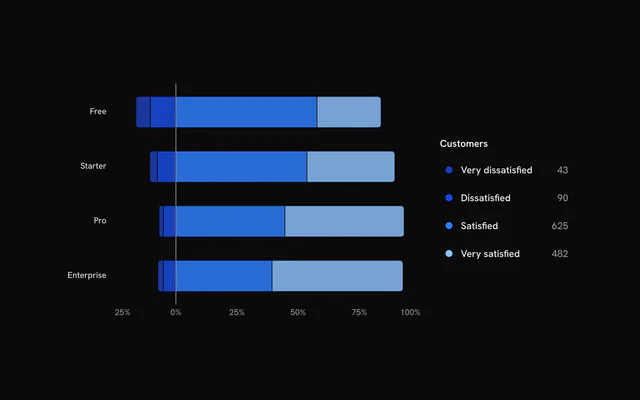
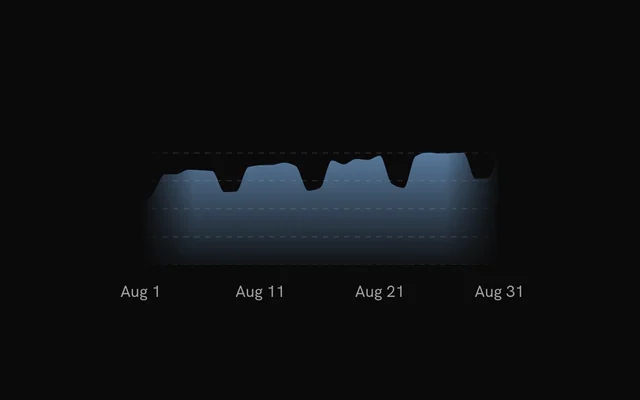
- Normalized Stream ChartStream chart`offset="expand"` fills every week to 100%, so each band reads as that source's share.
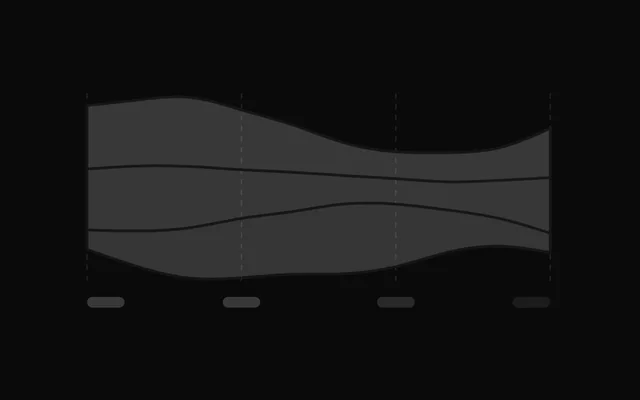
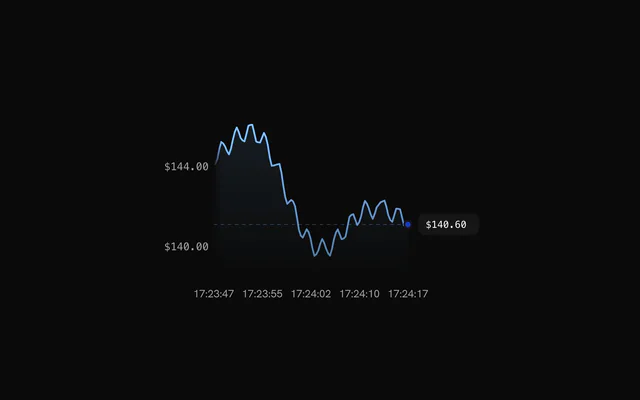
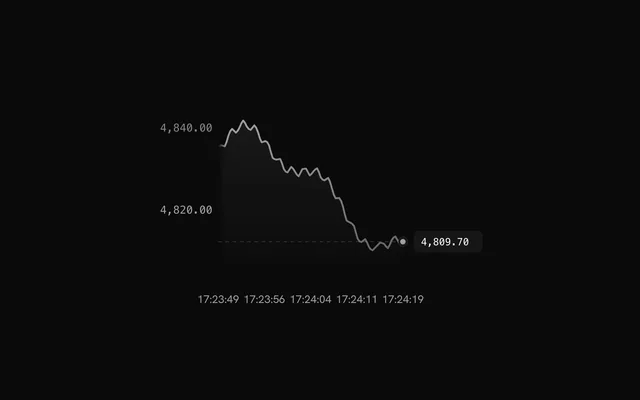
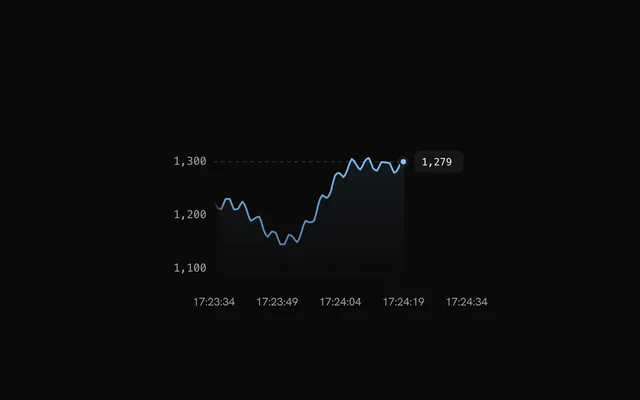
- Stream Chart Loading StateStream chartMuted wavy bands hold the space while loading, then the real layers sweep in from the left.
Or describe it. With Pro, your AI agent installs the stream chart example you describe, on your framework.
Get ProGalleries
More chart examples
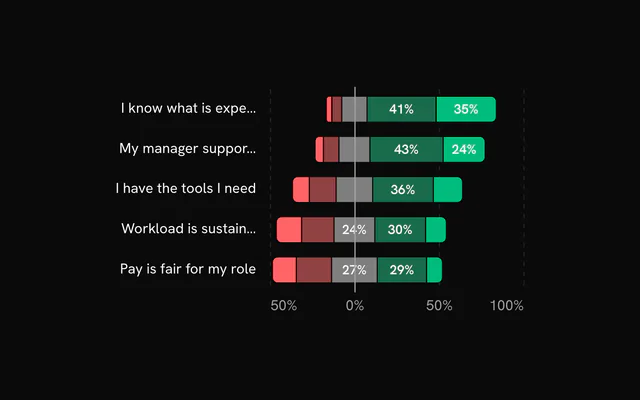
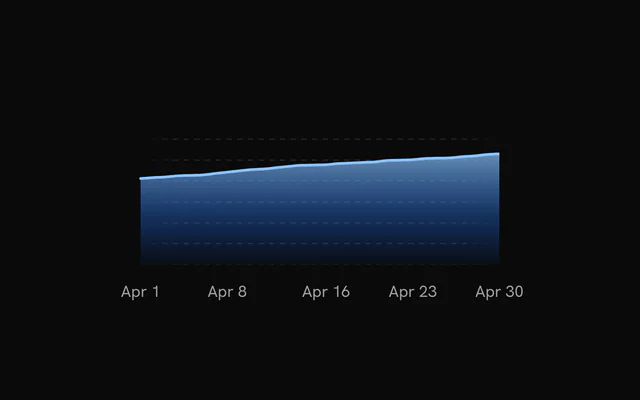
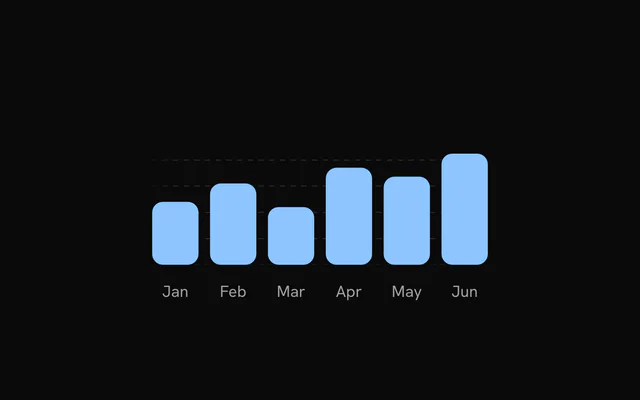
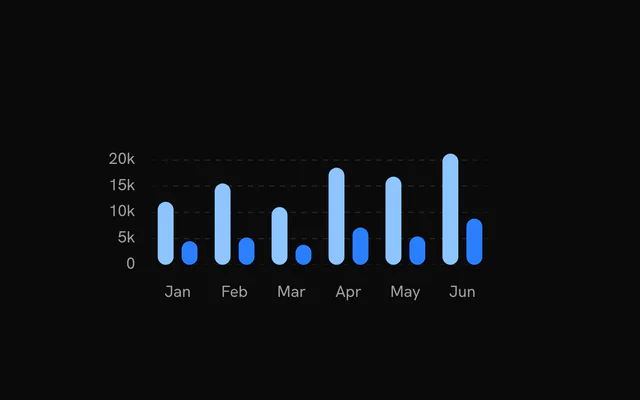
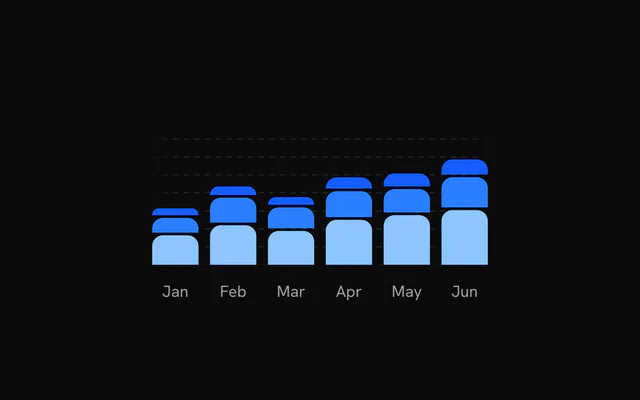
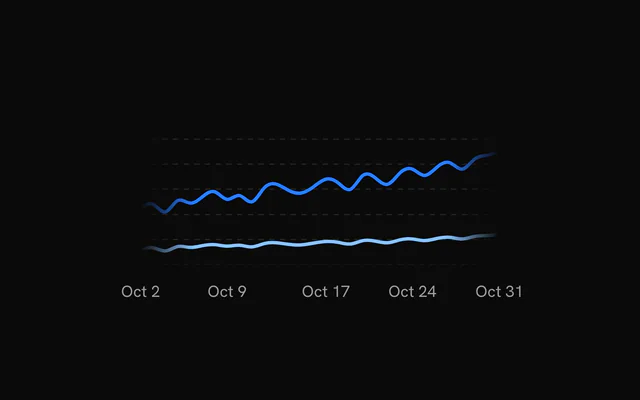
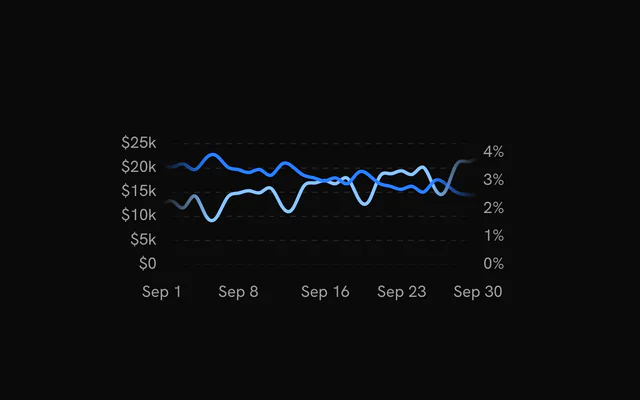
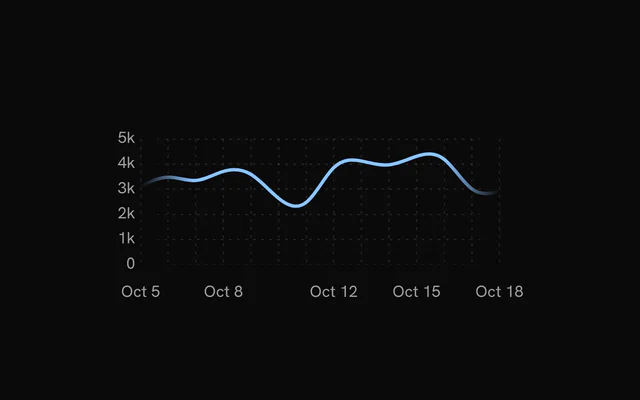
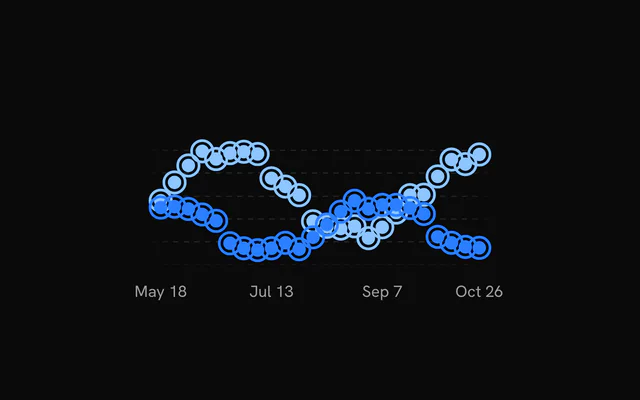
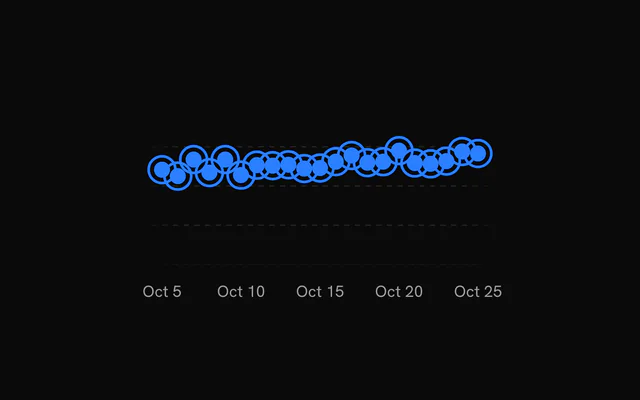
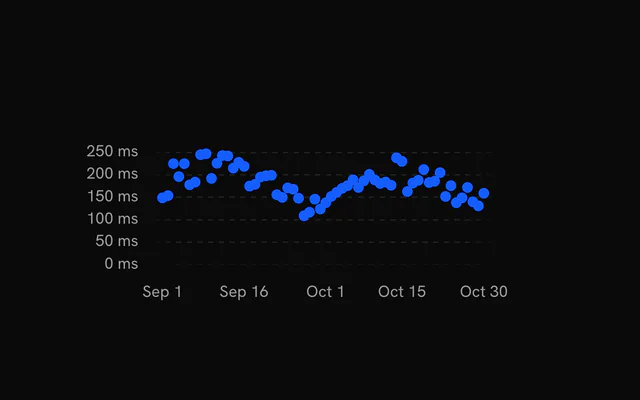
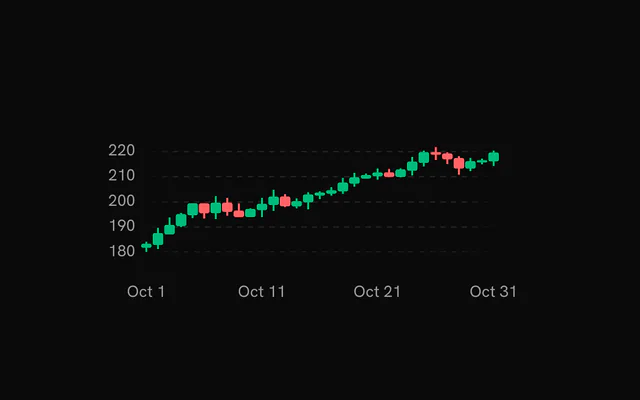
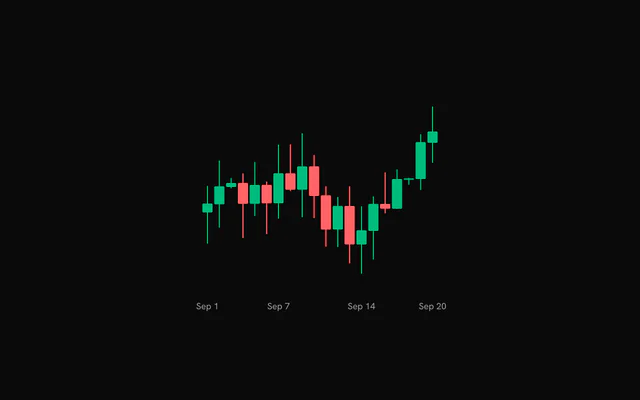
8 more chart types, free: open one for its examples and their code.
Pricing
Stream Chart examples MCP, with Pro
Your AI agent installs any of the 1434 examples, and every component, block and icon, with every Pro plan.
4.9/5 out of 5 · 150+ reviewsfrom 150+ founders and developers.
- Secure checkout via Stripe
- Code lives in your repo
- Keep what you've shipped if you cancel
- License terms
FAQ
Frequently asked questions
3: Stream Chart, Normalized Stream Chart and Stream Chart Loading State. Each page has the live chart, its code and a one-line install.
Signed in, copy the chart's command: `npx shadcn@latest add` with its URL. It adds the chart to `components/charts`, the `chart-kit` kit every chart imports, and `@tanstack/charts`. Import the chart and render it.
Yes. Every chart is free to use in personal and commercial projects. Seeing the code and installing it takes a free account, one tap with Google or GitHub. Pro is the site's paid plan for blocks, the Pro collections and the MCP, and the charts don't need it.
4.9 out of 5 from 150+ developers


Every stream chart example. One prompt away.
Every stream chart example is free with an account. With Pro, your AI agent installs them from a prompt.
Get Pro