shadcn.io is an independent project built on shadcn/ui
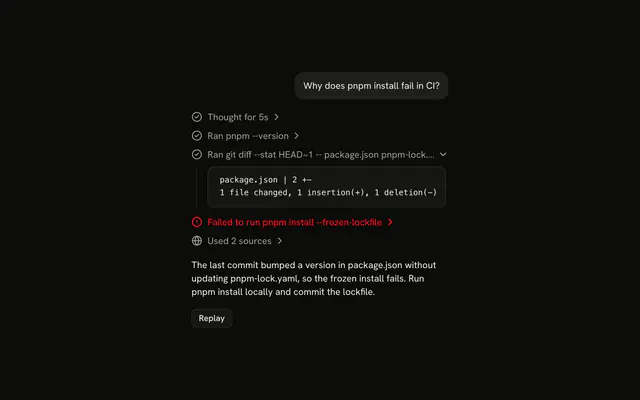
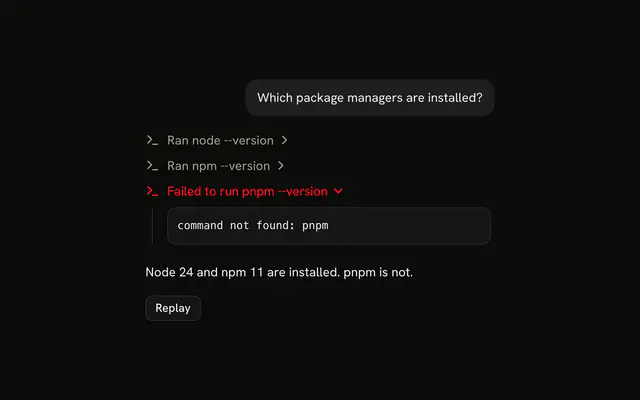
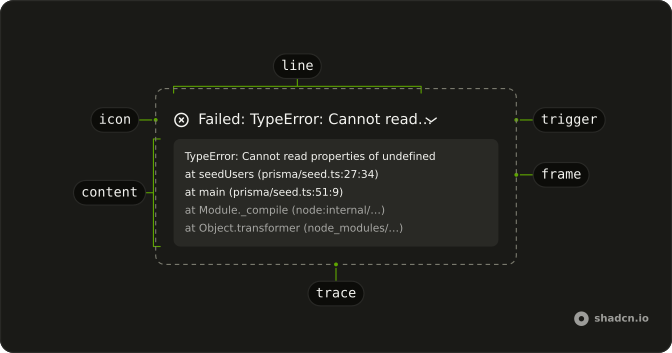
Stack Trace shows a tool call that threw as one line in the destructive color, Failed: TypeError: …, which opens on the full error and its frames. Your own code's frames come first, as links to the file and line, and the framework's fold away under a line of their own.
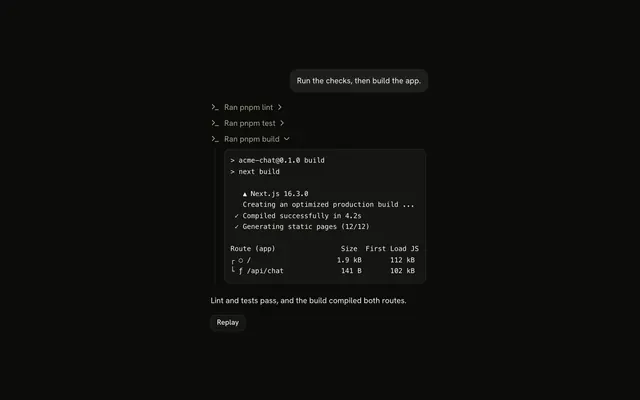
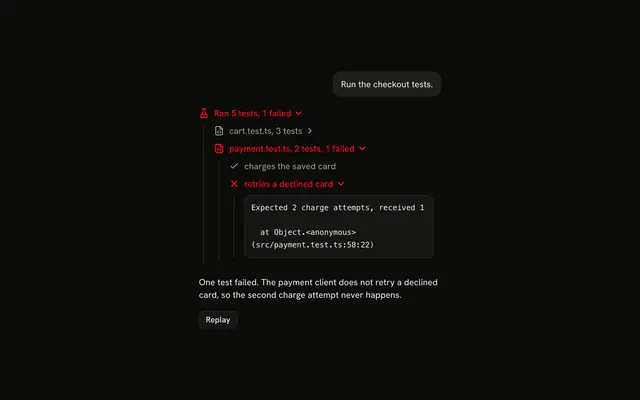
It is a pattern built from Trace, so the code is yours. For a command that ran and printed its errors, such as a lint, use Terminal, and for failing tests, Test Results.
Installation
Stack Trace is a pattern. The command adds the parts it's built from, Trace and Code Block for the output of the calls around it, and the code to copy is the demo's.
Anatomy
Usage
import { CircleXIcon } from "lucide-react";
import {
  Trace, TraceCollapsible, TraceCollapsibleContent,
  TraceCollapsibleTrigger, TraceIcon, TraceLine, TraceTitle,
} from "@/components/ui/trace";
export function StackTrace(props: { stack: string }) {
const [error, ...frames] = props.stack.split("\n").map((line) => line.trim());
return (
<Trace>
<TraceCollapsible>
<TraceCollapsibleTrigger>
<TraceLine status="error">
<TraceIcon>
<CircleXIcon aria-hidden="true" />
</TraceIcon>
<TraceTitle>Failed: {error}</TraceTitle>
</TraceLine>
</TraceCollapsibleTrigger>
<TraceCollapsibleContent>
<div className="flex flex-col gap-2 rounded-md bg-muted p-3 font-mono text-xs">
<p className="text-destructive">{error}</p>
<ol>
{frames.map((frame, index) => (
<li
className={
frame.includes("node_modules") ? undefined : "text-foreground"
}
key={index}
>
{frame}
</li>
))}
</ol>
</div>
</TraceCollapsibleContent>
</TraceCollapsible>
</Trace>
);
}The first line of a stack is the error, and each line after it is a frame. A frame from node_modules keeps the content's muted color while yours take text-foreground, so the frames you can fix stand out. Each frame is keyed by its place, since a recursive call repeats the same line. The title truncates on a narrow screen, which is why the content repeats the error in full.
Accessibility
The failed call's line is a <button> with aria-expanded, named by its whole title even where the text is cut off on screen, so a screen reader hears Failed and the full error. In the demos, each of your frames is a link with a focus ring, and the framework frames sit behind a second button, in a list that takes focus so the keyboard can scroll its long lines. The icons are hidden from screen readers and the red is only visual, which is why the title starts with Failed. The full error and the framework frames are set left to right, so they keep their order on a right-to-left page.
- Tab
- Moves focus to the failed call's line, then through an open stack: each of your frames, the framework frames' line, and their list once it is open.
- Shift+Tab
- Moves focus to the previous focusable element.
- Enter
- When focus is on a line, opens or closes it. When focus is on a frame, follows its link.
- Space
- When focus is on a line, opens or closes it.
- Arrow Right
- When focus is on the framework frames' list, scrolls its long lines right.
- Arrow Left
- When focus is on the framework frames' list, scrolls its long lines back left.
Demos
Frame links
A React render that failed in formatInvoice, open from the start. formatInvoice and InvoiceTable are links titled with their name and file, and the unnamed arrow function between them is one titled with its file and line alone. Array.map has no file, so it folds with the four react-dom frames under 5 framework frames. Use this shape outside a chat too, in an error panel or a log viewer.
AI SDK
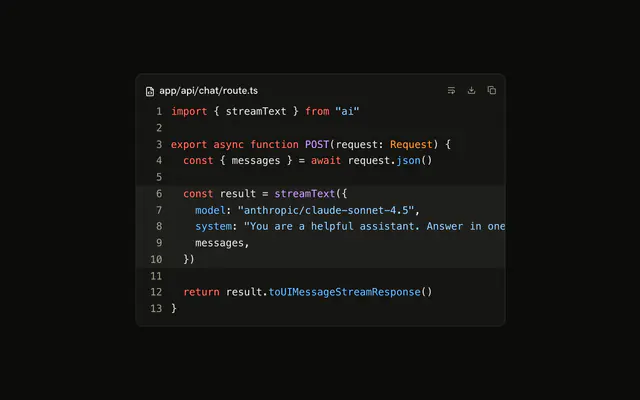
When a tool's execute throws, its part arrives in output-error, and its errorText is whatever the response's onError returns. With no onError, every failure arrives as the same sentence, An error occurred, with neither the message nor the frames, so pass one to toUIMessageStreamResponse:
return result.toUIMessageStreamResponse({
  onError: (error) => {
    if (!(error instanceof Error)) {
      return String(error);
    }
    return process.env.NODE_ENV === "development"
      ? (error.stack ?? error.message)
      : error.message;
  },
});
A stack names your server's files and functions, so this sends it only in development. In production it sends the message alone, which can still mention a table or a path, so throw errors whose text you are happy to show. The same onError sets the text of every error the stream sends, not only a tool's.
On the client, split errorText on new lines: the first is the error and the rest are frames.
if (part.state === "output-error") {
  const [error, ...frames] = part.errorText
    .split("\n")
    .map((line) => line.trim());

  return <TraceCollapsible>…</TraceCollapsible>;
}
Map the tool's other states as Tool does.
Migrating from AI SDK Elements
If you added Stack Trace from AI SDK Elements (opens in a new tab), your project has a components/ai-elements/stack-trace.tsx wrapper. Paste this prompt into your coding agent to rebuild it on Trace. Every export keeps its name and props, so the code that uses it keeps working.
Migrate components/ai-elements/stack-trace.tsx from AI SDK Elements to the shadcn.io Trace component.

Keep every export, with the same name and props, so the code that imports it keeps working. Only change how each part renders.

1. Read https://www.shadcn.io/ui/ark/stack-trace.md and build Stack Trace the same way. If the project hasn't got Trace, run the command in its Installation section.
2. Rebuild each part:
   - StackTrace renders a Trace with a TraceCollapsible. Keep trace, open, defaultOpen, onOpenChange and onFilePathClick, and the parsing. Pass open and defaultOpen to the TraceCollapsible, and call onOpenChange with details.open from its onOpenChange.
   - StackTraceHeader renders a TraceCollapsibleTrigger with a TraceLine with status="error" and a TraceIcon.
   - StackTraceError renders a TraceTitle, like "Failed: TypeError: …". Keep StackTraceErrorType and StackTraceErrorMessage as spans inside it.
   - StackTraceContent renders a TraceCollapsibleContent.
   - StackTraceFrames renders the frames as a list in a muted, monospace block. Dim the frames from node_modules, and keep the file path buttons.
   - StackTraceExpandButton renders nothing, since the whole line opens the frames.
   - Buttons cannot sit inside a trigger. Render StackTraceActions and StackTraceCopyButton next to the TraceCollapsibleTrigger, not inside it.
3. Remove the imports the file no longer uses.
4. Run the type checker and fix any errors.
FAQ
How do I split a stack trace into the error and its frames?
Split it on new lines and trim each one. The first line is the error, such as TypeError: Cannot read properties of undefined, and every line after it is a frame, such as at seedUsers (prisma/seed.ts:27:34). The demos read each frame's function, file and line with one regular expression.
The expression also takes a frame with no function name, such as at /app/server.js:12:3, which Node prints for an anonymous function, and its link shows the file and line alone. A frame with no file, such as at new Promise (<anonymous>), doesn't match, so the demos fold it with the framework frames as its raw line.
Why are some Stack Trace frames muted or folded away?
They come from code the reader can't fix. The demo at the top of the page treats a frame as the framework's when its path is in node_modules or one of Node's own node: modules, or when it has no file at all, and folds those under a line such as 4 framework frames. The Frame links demo leaves out the node: check.
What's left are the frames from your own code, where the bug usually is, so they come first. The Usage example keeps every frame in one list and mutes the node_modules ones instead.
How do I make a stack frame open the file in my editor?
Point each frame's link at a URL your editor handles. In the demos the link is a placeholder, a hash such as #app/lib/billing.ts:42, so set its href to your own. A vscode://file/ URL followed by the absolute path, the line and the column opens the file in VS Code.
Node prints each frame's absolute path, or a file:// URL for an ES module, so drop the scheme where there is one. To link to your repository's file view instead, strip the project's root from the path and add the line the way your host expects.
Should a Stack Trace start open?
When the failure is the reason the reply stopped, yes. The demo at the top of the page renders the failed call with defaultOpen as soon as it fails, so the error and your frames are in view without a click.
Leave the framework frames closed, since they are rarely the place to look. A failure the agent recovered from, retrying and then succeeding, can start closed, so the line records it without taking over the reply.
Why does my AI SDK tool error say An error occurred, with no stack?
The AI SDK hides errors on their way to the browser. Unless you pass onError to toUIMessageStreamResponse, every failed tool part arrives with errorText set to the sentence An error occurred, so a Stack Trace line can only say Failed: An error occurred.
Return error.stack from onError in development and the error's message in production, as the AI SDK section shows. That function receives every error the stream sends, including one from the model provider, and a thrown value need not be an Error, so check before you read its stack.
Is it safe to send a stack trace to the browser?
Only in development. A stack holds your server's file paths, folder names and function names, a map of your code you don't want to hand to every visitor.
In production, send the error's message, or a short id that points to the full stack in your server's logs, so a report from a user still leads you to the failure. The AI SDK section's onError sends the stack only while NODE_ENV is development.
Can people open the frames of a Stack Trace with the keyboard?
Yes. The failed call's line is a button in the tab order, and Enter or Space opens or closes it. Inside, each of your frames is a link, so Tab moves through them in order and Enter follows one, and the framework frames' line opens the same way as the first.
A screen reader hears the whole error in the button's name even when the line is cut off on screen. Once open, the framework frames' list is a tab stop of its own, so the arrow keys scroll its long lines. The Accessibility section lists every key.
Is this the same as AI SDK Elements' Stack Trace?
It does the same job without a component of its own. AI SDK Elements' Stack Trace is a card with its own header, copy button and frame list, while here it is an error Trace line that opens on the frames and sits in the reply like every other step.
The Migrating from AI SDK Elements section has a prompt for your coding agent that rebuilds components/ai-elements/stack-trace.tsx on Trace and keeps its exports.
API Reference
Stack Trace has no props of its own. The failed call is a Trace collapsible with status="error" on its TraceLine, and the output of the calls that ran is a Code Block.