shadcn.io is an independent project built on shadcn/ui
Installation
The command adds the example above to components/charts/ and, the first time, the chart kit to components/ui/charts/. Both are source files in your project from then on: read them, change them, delete what you don't use.
Usage
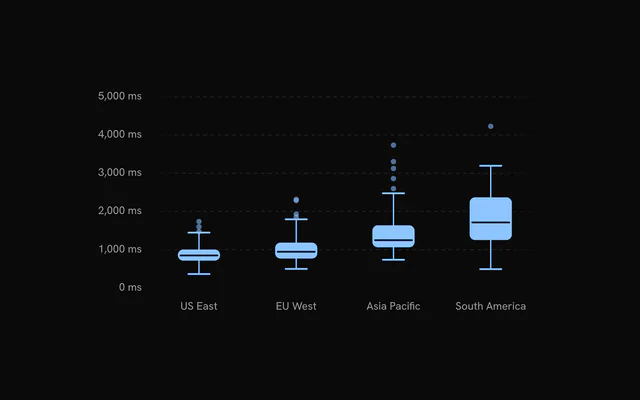
Pass the raw observations with a category on each row. The chart works out the quartiles itself.
<script setup lang="ts">
import {
  BoxPlot,
  BoxPlotChart,
  BoxPlotTooltip,
  BoxPlotXAxis,
  BoxPlotYAxis,
  Grid,
} from "@/components/ui/charts";

// One row per page load.
const data = [
  { ms: 820, region: "US East" },
  { ms: 940, region: "US East" },
  { ms: 1310, region: "US East" },
  { ms: 760, region: "US East" },
  { ms: 1020, region: "EU West" },
  { ms: 1180, region: "EU West" },
  { ms: 2240, region: "EU West" },
  { ms: 980, region: "EU West" },
];

const formatMs = (value: number) => `${value} ms`;
</script>

<template>
  <BoxPlotChart
    ariaLabel="Page load time by region"
    category-key="region"
    :data="data"
  >
    <Grid horizontal />
    <BoxPlot data-key="ms" label="Page load" />
    <BoxPlotXAxis />
    <BoxPlotYAxis :format-value="formatMs" />
    <BoxPlotTooltip />
  </BoxPlotChart>
</template>
Anatomy
categoryKey splits the rows into categories. Each BoxPlot summarizes one numeric column in every category.
<BoxPlotChart category-key="region" :data="data">
  <Grid horizontal />
  <BoxPlot data-key="desktop" fill="var(--chart-1)" label="Desktop" />
  <BoxPlot data-key="mobile" fill="var(--chart-3)" label="Mobile" />
  <BoxPlotXAxis />
  <BoxPlotYAxis />
  <BoxPlotTooltip />
</BoxPlotChart>BoxPlotChart: Groups the rows bycategoryKeyand sets up both axes.Grid: Guide lines along the value axis.BoxPlot: One series: a box, whiskers and outlier dots per category.BoxPlotXAxis: Categories on a vertical chart, values on a horizontal one.BoxPlotYAxis: Values on a vertical chart, categories on a horizontal one.BoxPlotTooltip: The hovered category's summary.
Whiskers and outliers
Quartiles are interpolated linearly. Each whisker reaches the furthest observation within 1.5 interquartile ranges of the box, and anything beyond that is an outlier, drawn as a dot.
Set :showOutliers="false" to hide the dots. The value axis still makes room for them, so pass domain if you want it tighter.
Horizontal boxes
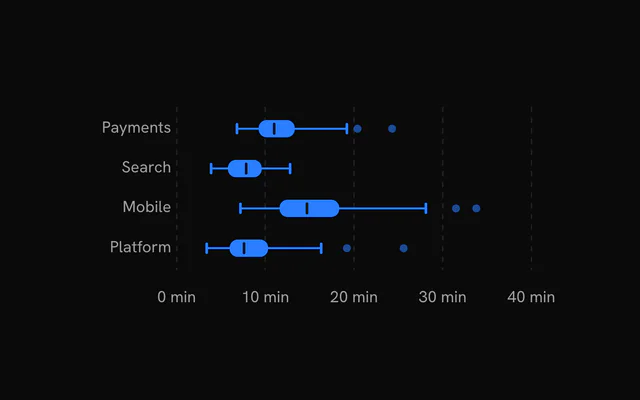
Set orientation="horizontal" to list the categories down the side. The left margin grows to fit the longest name, and the tooltip moves next to the hovered box.
The guides follow the value axis, so use <Grid vertical /> here.
Two series per category
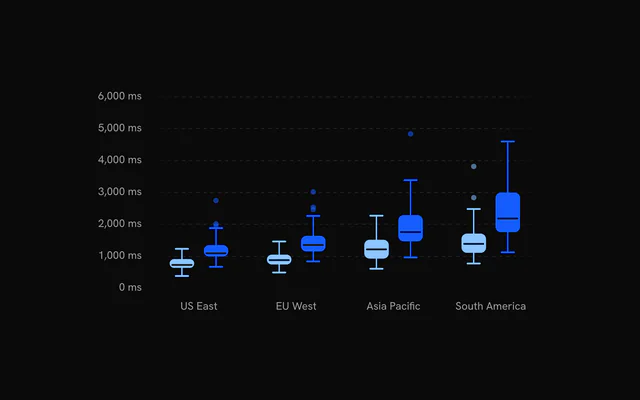
Add a second BoxPlot and each category's band splits between the series, in the order you write them. boxWidth sets each box's share of its slot (0.62), up to 88 px wide.
Customization
The kit is in your project, in components/ui/charts/: your framework's components over a shared core/. Change a default there and every chart picks it up.
class goes on the chart's container, so size and spacing are utility classes.
With one series, the tooltip lists the high, Q3, median, Q1 and low values, plus the outlier count when there are any. With several, it shows each series' median.
For your own, pass content. Its point has the category and a series array, each summary with low, q1, median, q3, high, count and the outliers themselves.
<BoxPlotTooltip>
  <template #content="{ point }">
    <TooltipContent
      :rows="[
        {
          color: 'var(--chart-2)',
          label: 'Median',
          value: `${point.series[0].median} min`,
        },
        {
          color: 'var(--chart-2)',
          label: 'Deploys',
          value: point.series[0].count,
        },
      ]"
      :title="point.category"
    />
  </template>
</BoxPlotTooltip>
Where a part renders content of its own, you pass it in. In Vue:
BoxPlotTooltip:<template #content="{ point, index }">
Loading state
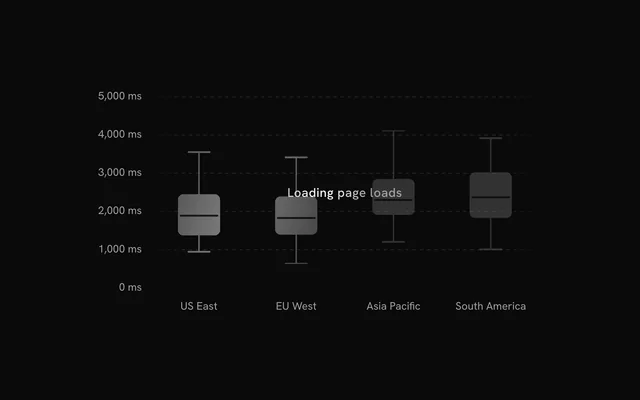
With status="loading" the chart draws a skeleton box for each category (four when there's no data yet) and ignores the pointer. loadingLabel adds a line of text over it. On "ready" the real boxes unfold.
To hold the space before you have any rows, render <BoxPlotChartLoading />. Pass it the chart's orientation so the skeleton lies the same way.
Animation
Each box unfolds from its middle over animationDuration (1100 ms), one category after another. Set :animate="false" on the BoxPlot to draw it in place.
When the data changes, boxes and whiskers glide to their new values over 500 ms. Reduced motion skips the entrance and the glide.
Theming
Every color in the kit is one of your theme's tokens or a mix of them, except --chart-positive, a fixed green. A preset or the .dark class restyles the chart, and overriding a token in your CSS changes it everywhere.
A BoxPlot takes one color as fill for the box, whiskers and outliers. The median is a line in --chart-background, so it reads as a cut through the box in either theme.
| Token | Default | Paints |
|---|---|---|
--chart-1 | your theme's | the first series |
--chart-2 | your theme's | the second series |
--chart-3 | your theme's | the third series |
--chart-background | --card | dot halos, the gaps between stacked marks |
--chart-grid | --border | grid lines |
--chart-label | --muted-foreground | tick labels |
--chart-foreground-muted | --muted-foreground mixed toward --background | skeletons and faded marks |
--chart-tooltip-background | --popover | the tooltip panel |
:root {
  --chart-background: var(--background);
  --chart-grid: var(--muted);
}
Accessibility
The chart is an image named by ariaLabel ("Box plot" by default). Use ariaDescription for the comparison the boxes make, such as which region is slowest and by how much.
- Tab
- Moves focus to the chart and shows the first category.
- Arrow Right
- Moves to the next category. ArrowDown does the same.
- Arrow Left
- Moves to the previous category. ArrowUp does the same.
- Home
- Jumps to the first category.
- End
- Jumps to the last category.
API reference
Vue takes the same props as React, in camelCase or kebab-case, with class for className. Render props are scoped slots (#content), and callbacks such as onHoverChange can be written as listeners (@hover-change).
BoxPlotChart
categoryKeystring
Key of the column naming each row's category: one box per category (per series), in first-seen order.
orientation?"vertical" | "horizontal"
"vertical": categories along the bottom, values up the side. "horizontal": categories down the side, values along the bottom.
- Type
"vertical" | "horizontal"- Default
"vertical"
domain?readonly [number, number]
The value axis range [min, max]. Defaults to the observations' extent, rounded to nice values.
datareadonly DistributionRow[]
The observations, one object per row. Each series reads its dataKey column; rows without a finite number there are skipped.
aspectRatio?string
Width to height ratio of the chart, for example "2 / 1" or "16 / 9".
- Default
"2 / 1"
margin?Partial<ChartMargin>
Space around the plot in pixels, per side. Each side defaults to fit the chart's axes.
- Type
Partial<ChartMargin>
animationDuration?number
Duration of the entrance in milliseconds.
- Default
1100
ariaLabel?string
Accessible name of the chart. Defaults to its kind, for example "Histogram" or "Box plot".
ariaDescription?string
Accessible description of the chart.
status?ChartStatus
"loading" draws a shimmering skeleton shaped like the chart in place of its marks and ignores the pointer; switching to "ready" plays the entrance. Switching back to "loading" fades the marks out first.
- Default
"ready"
loadingLabel?string
Text shown centered over the plot, with a shimmer, while status is "loading". Nothing is shown when it is unset or empty.
class?string
Class names added to the chart's container.
style?CSSProperties
Inline styles for the chart's container.
children?ReactNode
The chart's parts: its series, Grid, axes and tooltip.
BoxPlot
radius?number
Corner radius of the box in pixels.
- Default
6
boxWidth?number
Width of the box as a share of its category's band, from 0 to 1.
- Default
0.62
showOutliers?boolean
Draw the observations past the whiskers (1.5 times the interquartile range) as dots.
- Default
true
dataKeystring
Key of the numeric column this series reads from each row.
label?string
The series' name in the tooltip and legend. Defaults to dataKey.
fill?string
Fill colour. Defaults to the series' palette colour, var(--chart-1) for the first.
stroke?string
Outline colour. Defaults to the fill.
fadedOpacity?number
Opacity of the other items while one is hovered (and of the other series while a legend row is).
- Default
0.3
animate?boolean
Play the entrance.
- Default
true
Grid
horizontal?boolean
Show horizontal grid lines.
- Default
true
vertical?boolean
Show vertical grid lines.
- Default
false
numTicksRows?number
Number of horizontal grid lines. Ignored when rowTickValues is set.
- Default
5
numTicksColumns?number
Number of vertical grid lines.
- Default
10
rowTickValues?number[]
Explicit y values for the horizontal grid lines. Overrides numTicksRows.
stroke?string
Color of the grid lines.
- Default
"var(--chart-grid)"
loadingStroke?string
Grid color while the chart is loading. Falls back to stroke.
strokeOpacity?number
Opacity of the grid lines.
- Default
1
strokeWidth?number
Width of the grid lines in px.
- Default
1
strokeDasharray?string
Dash pattern of the grid lines.
- Default
"4,4"
highlightRowValues?number[]
Y values of horizontal lines drawn with the highlight styling, for example a zero baseline.
highlightRowStroke?string
Color of the highlighted rows.
- Default
"var(--chart-foreground-muted)"
highlightRowStrokeOpacity?number
Opacity of the highlighted rows.
- Default
1
highlightRowStrokeWidth?number
Width of the highlighted rows in px.
- Default
1
highlightRowStrokeDasharray?string
Dash pattern of the highlighted rows.
- Default
"0"
fadeHorizontal?boolean
Fade the horizontal lines toward transparent at the left and right edges.
- Default
true
fadeVertical?boolean
Fade the vertical lines toward transparent at the top and bottom edges.
- Default
false
hideHorizontalEdgeLines?boolean
Drop the first and last horizontal line (kept when two or fewer remain).
- Default
false
hideVerticalEdgeLines?boolean
Drop the first and last vertical line (kept when two or fewer remain).
- Default
false
shimmer?boolean
While the chart is loading, sweep a bright band across the grid.
- Default
false
shimmerStroke?string
Color of the shimmer band.
- Default
"color-mix(in oklch, var(--bkm-foreground) 68%, transparent)"
shimmerSpeed?number
Speed multiplier of the shimmer sweep. 2 is twice as fast.
- Default
1
BoxPlotXAxis
numTicks?number
Target number of tick labels on a value axis.
- Default
5
formatLargeNumbers?boolean
Abbreviate values of 1000 and above as thousands, for example 2k or 1.5k. Ignored when formatValue is set.
- Default
true
formatValue?(value: number) => string
Formats a value tick into its label, for example (value) => \${value} ms\``.
- Type
(value: number) => string
BoxPlotYAxis
numTicks?number
Target number of tick labels on a value axis.
- Default
5
formatLargeNumbers?boolean
Abbreviate values of 1000 and above as thousands, for example 2k or 1.5k. Ignored when formatValue is set.
- Default
true
formatValue?(value: number) => string
Formats a value tick into its label, for example (value) => \${value} ms\``.
- Type
(value: number) => string
BoxPlotTooltip
#content?slot: { point, index }
Replaces the default panel body (a title over one row per value) with your own content for the hovered item.
formatValue?(value: number) => string
Formats the values the default body shows. Defaults to the chart's value axis formatValue, else en-US numbers.
- Type
(value: number) => string
BoxPlotChartLoading
orientation?"vertical" | "horizontal"
"vertical": the skeleton's categories along the bottom. "horizontal": down the side. Defaults to the chart's own default.
- Type
"vertical" | "horizontal"
aspectRatio?string
Width to height ratio of the placeholder, for example "2 / 1".
- Default
"2 / 1"
margin?Partial<ChartMargin>
Space around the plot in pixels, per side.
- Type
Partial<ChartMargin>
label?string
Text shown centered over the skeleton, with a shimmer. Nothing is shown when it is unset or empty.
class?string
Class names added to the placeholder's container.
- Default
""
Examples
4 examples on Vue, each live with its code and its own install command.