shadcn.io is an independent project built on shadcn/ui
Installation
The command adds the example above to components/charts/ and, the first time, the chart kit to components/ui/charts/. Both are source files in your project from then on: read them, change them, delete what you don't use.
Usage
Pass data and a dataKey, the field to plot or a function that returns it. With no width the sparkline fills its parent, and height is 32 px unless you set it.
<script setup lang="ts">
import { AreaSparkline } from "@/components/ui/charts";

const data = [
  { day: "Mon", visitors: 1240 },
  { day: "Tue", visitors: 1385 },
  { day: "Wed", visitors: 1310 },
  { day: "Thu", visitors: 1492 },
  { day: "Fri", visitors: 1568 },
  { day: "Sat", visitors: 1104 },
  { day: "Sun", visitors: 1022 },
];
</script>

<template>
  <AreaSparkline
    ariaLabel="Visitors this week"
    :data="data"
    data-key="visitors"
    :height="40"
  />
</template>
Anatomy
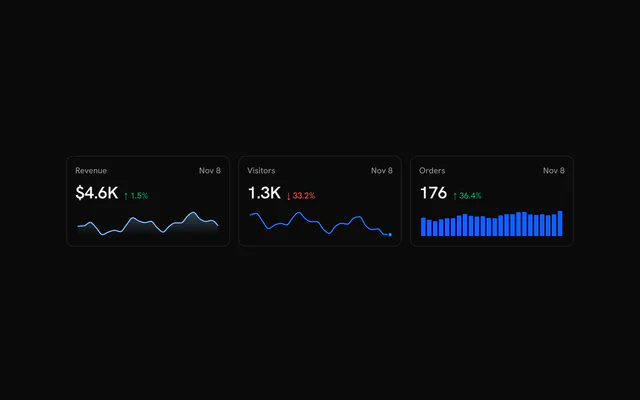
Three components, one per shape. None of them take children: the data, the colors and the hover are all props.
<div class="grid gap-3">
  <LineSparkline :data="data" data-key="value" end-dot />
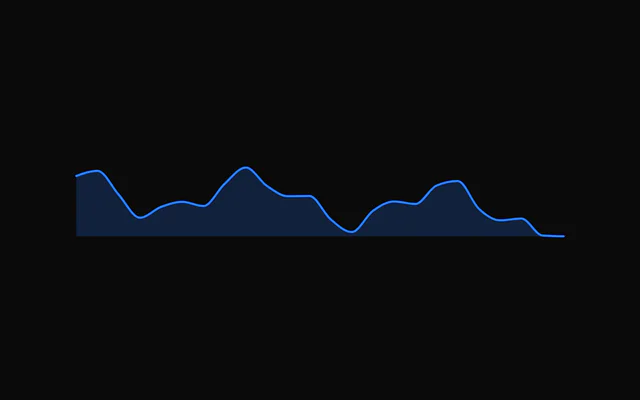
  <AreaSparkline :data="data" data-key="value" fill="solid" />
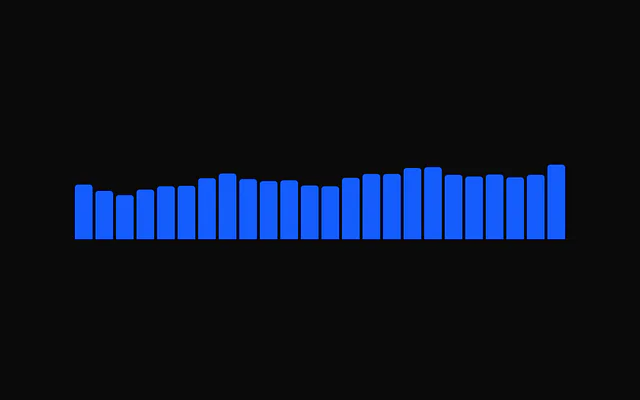
  <BarSparkline :bar-radius="2" :data="data" data-key="value" />
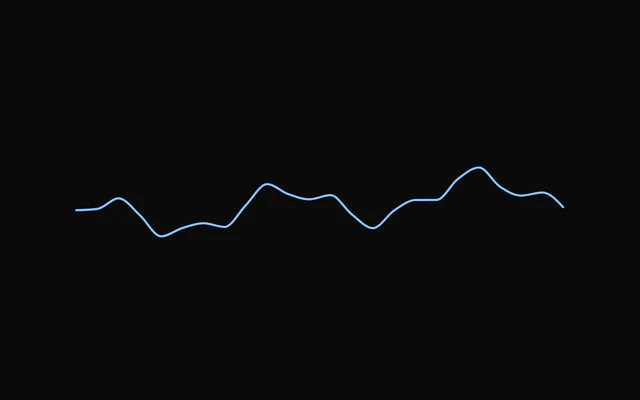
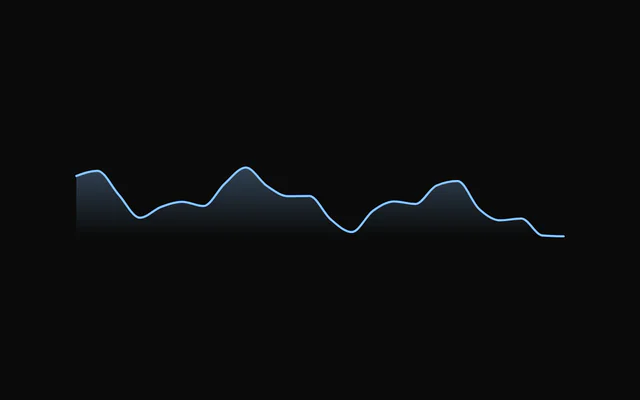
</div>LineSparkline: A line, with an optional dot on the latest point.AreaSparkline: The same line over a gradient or a solid fill.BarSparkline: Bars from zero, negative values included, drawn as one path.
Showing the hovered value
A sparkline has no tooltip. Keep the hovered index in state, pass it as hoverIndex with onHoverChange, and render the value wherever it belongs, such as the card's big number. onHoverChange gets the row too, and null when the pointer leaves.
useSparklineHover() does the bookkeeping: spread its sparklineProps on the sparkline and read datum or index from it.
Synced rows
Give several sparklines the same hoverIndex and onHoverChange and they move as one: point at a day on any row and every crosshair goes to that day.
Crosshair styles
crosshair is "dashed" by default. "solid" draws a plain line, "gradient" one that fades at both ends, and false none. :dot="false" hides the dot on the hovered point.
Hover feel
The crosshair and the dot spring from point to point. Pass only what you want to change to springConfig, such as { damping: 45, stiffness: 600 } for a snappier feel, or :hoverTransition="false" to jump straight there.
Negative values
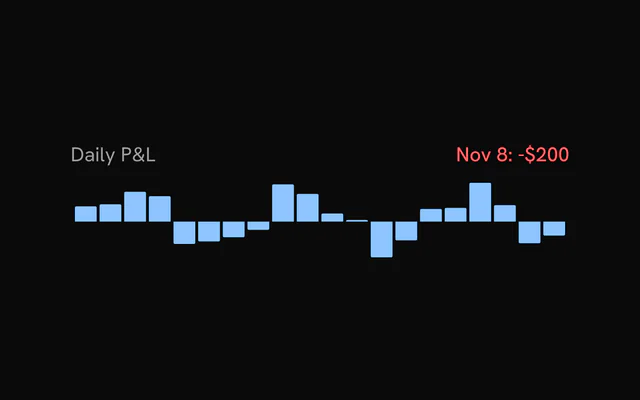
BarSparkline always includes zero, so losses hang below the baseline without extra props. barGap and barRadius set the spacing and the corners.
Tables and grids
Give a sparkline a fixed width in a table column and it skips measuring. Without one it fills its parent, and every sparkline on the page shares a single ResizeObserver, so a grid of dozens stays cheap.
Customization
The kit is in your project, in components/ui/charts/: your framework's components over a shared core/. Change a default there and every chart picks it up.
class goes on the chart's container, so size and spacing are utility classes.
color takes a token or any CSS color, and curve picks "monotone" (the default), "linear", "natural" or "step". A sparkline scales to its own data, so pass the same yDomain to every row of a table when their heights should compare.
padding keeps the stroke and the hover dot from being clipped at the edges. It's 4 px by default, 2 px for bars.
<LineSparkline
  color="var(--chart-2)"
  curve="step"
  :data="data"
  data-key="seats"
  end-dot
  :height="40"
  :y-domain="[0, 120]"
/>
Loading state
Sparklines have no loading state. Reserve the space with a Skeleton of the same height until the data is there.
Animation
On mount a line draws along its stroke, an area wipes in from the left and bars grow from the baseline, over animationDuration (900 ms). New data morphs the shape over dataTransitionDuration (500 ms), and 0 snaps.
:animate="false" turns both off. With reduced motion on, the entrance is a 200 ms fade and new data snaps into place.
Theming
Every color in the kit is one of your theme's tokens or a mix of them, except --chart-positive, a fixed green. A preset or the .dark class restyles the chart, and overriding a token in your CSS changes it everywhere.
Each sparkline has one color, --chart-line-primary unless you pass another. The examples color a row by its trend with --chart-positive and --chart-negative.
| Token | Default | Paints |
|---|---|---|
--chart-line-primary | --chart-1 | a series with no color of its own |
--chart-1 | your theme's | the first series |
--chart-2 | your theme's | the second series |
--chart-positive | a fixed green | values above the baseline in profit and loss |
--chart-negative | --destructive | values below the baseline in profit and loss |
--chart-crosshair | --muted-foreground at 75% | the hover line |
:root {
  --chart-line-primary: var(--chart-3);
  --chart-crosshair: var(--primary);
}
Accessibility
A sparkline is an image with a label. Without ariaLabel it writes its own from the data, such as "30 points, from 1.2K to 1.8K, up 50%". Pass one when the metric's name matters more than the numbers.
An interactive sparkline is a tab stop. :interactive="false" removes it, along with the hover, which is what you want for a purely decorative line in a dense table.
- Tab
- Moves focus to the sparkline.
- Arrow Right
- Moves to the next point. ArrowUp does the same.
- Arrow Left
- Moves to the previous point. ArrowDown does the same.
- Home
- Jumps to the first point.
- End
- Jumps to the last point.
- Escape
- Clears the hovered point.
API reference
Vue takes the same props as React, in camelCase or kebab-case, with class for className. Render props are scoped slots (#content), and callbacks such as onHoverChange can be written as listeners (@hover-change).
LineSparkline
curve?SparklineCurve
How the points are joined.
- Default
"monotone"
strokeWidth?number
Line width in px.
- Default
1.5
endDot?boolean
Keep a dot on the last point when not hovering.
- Default
false
showHighlight?boolean
On hover, fade the series and re-stroke the segment around the hovered point at full strength: the main charts' highlight.
- Default
true
inactiveOpacity?number
Series opacity while hovering (with showHighlight).
- Default
0.5
datareadonly T[]
Rows to plot.
dataKeySparklineDataKey<T>
Field (or accessor) holding the numeric value.
- Type
SparklineDataKey<T>
width?number
Fixed width in px. Omit to fill the parent width.
height?number
Height in px.
- Default
32
color?string
Series colour.
- Default
"var(--chart-line-primary)"
padding?number | Partial<SparklinePadding>
Inner padding so strokes and the hover dot are not clipped: one number for every side, or some sides. Defaults to 4 (2 for bars).
- Type
number | Partial<SparklinePadding>
yDomain?readonly [number?, number?]
Override the value domain; undefined entries fall back to the data.
animate?boolean
Play the enter animation on mount. Respects prefers-reduced-motion.
- Default
true
animationDuration?number
Enter duration in ms.
- Default
900
animationEasing?string
Any CSS easing string.
- Default
"cubic-bezier(0.85, 0, 0.15, 1)"
dataTransitionDuration?number
Morph to new data instead of snapping, in ms. 0 snaps. Requires animate; snaps under prefers-reduced-motion.
- Default
500
crosshair?SparklineCrosshair
Hover guide line. Set false to hide.
- Default
"dashed"
dot?boolean
Show a dot on the hovered point.
- Default
true
hoverTransition?boolean
Spring the crosshair and dot between points, like the main charts' tooltip. Snaps under prefers-reduced-motion.
- Default
true
springConfig?Partial<SparklineSpringConfig>
Hover spring for the crosshair and dot. Defaults to the main charts' tooltip spring (300 / 30); pass only what you want to change, e.g. { damping: 40 }. Higher stiffness = snappier; lower damping = bouncier.
- Type
Partial<SparklineSpringConfig>
interactive?boolean
Track the pointer and the keyboard (←/→, Home/End, Esc) to show the hovered point. false: no hover state, no listeners, no tab stop.
- Default
true
hoverIndex?number | null
Controlled hovered index. Pass null for "not hovering".
- Type
number | null
onHoverChange?(index: number | null, datum: T | null) => void
Called when the hovered point changes (pointer or keyboard), with its index and row, or null and null on leave.
- Type
(index: number | null, datum: T | null) => void
aria-label?string
Accessible summary. Generated from the data when omitted.
ariaLabel?string
Accessible summary (the kit's other charts' name for aria-label).
class?string
Extra class name for the sparkline's element.
style?CSSProperties
Inline style for the sparkline's element.
AreaSparkline
fill?"gradient" | "solid"
Fill style: a gradient fading to the baseline, or one flat colour.
- Type
"gradient" | "solid"- Default
"gradient"
fillOpacity?number
Opacity of the fill at its strongest point.
- Default
0.3
curve?SparklineCurve
How the points are joined.
- Default
"monotone"
strokeWidth?number
Line width in px.
- Default
1.5
endDot?boolean
Keep a dot on the last point when not hovering.
- Default
false
showHighlight?boolean
On hover, fade the series and re-stroke the segment around the hovered point at full strength: the main charts' highlight.
- Default
true
inactiveOpacity?number
Series opacity while hovering (with showHighlight).
- Default
0.5
datareadonly T[]
Rows to plot.
dataKeySparklineDataKey<T>
Field (or accessor) holding the numeric value.
- Type
SparklineDataKey<T>
width?number
Fixed width in px. Omit to fill the parent width.
height?number
Height in px.
- Default
32
color?string
Series colour.
- Default
"var(--chart-line-primary)"
padding?number | Partial<SparklinePadding>
Inner padding so strokes and the hover dot are not clipped: one number for every side, or some sides. Defaults to 4 (2 for bars).
- Type
number | Partial<SparklinePadding>
yDomain?readonly [number?, number?]
Override the value domain; undefined entries fall back to the data.
animate?boolean
Play the enter animation on mount. Respects prefers-reduced-motion.
- Default
true
animationDuration?number
Enter duration in ms.
- Default
900
animationEasing?string
Any CSS easing string.
- Default
"cubic-bezier(0.85, 0, 0.15, 1)"
dataTransitionDuration?number
Morph to new data instead of snapping, in ms. 0 snaps. Requires animate; snaps under prefers-reduced-motion.
- Default
500
crosshair?SparklineCrosshair
Hover guide line. Set false to hide.
- Default
"dashed"
dot?boolean
Show a dot on the hovered point.
- Default
true
hoverTransition?boolean
Spring the crosshair and dot between points, like the main charts' tooltip. Snaps under prefers-reduced-motion.
- Default
true
springConfig?Partial<SparklineSpringConfig>
Hover spring for the crosshair and dot. Defaults to the main charts' tooltip spring (300 / 30); pass only what you want to change, e.g. { damping: 40 }. Higher stiffness = snappier; lower damping = bouncier.
- Type
Partial<SparklineSpringConfig>
interactive?boolean
Track the pointer and the keyboard (←/→, Home/End, Esc) to show the hovered point. false: no hover state, no listeners, no tab stop.
- Default
true
hoverIndex?number | null
Controlled hovered index. Pass null for "not hovering".
- Type
number | null
onHoverChange?(index: number | null, datum: T | null) => void
Called when the hovered point changes (pointer or keyboard), with its index and row, or null and null on leave.
- Type
(index: number | null, datum: T | null) => void
aria-label?string
Accessible summary. Generated from the data when omitted.
ariaLabel?string
Accessible summary (the kit's other charts' name for aria-label).
class?string
Extra class name for the sparkline's element.
style?CSSProperties
Inline style for the sparkline's element.
BarSparkline
barGap?number
Gap between bars in px.
- Default
2
barRadius?number
Corner radius away from the baseline, in px.
- Default
1
inactiveOpacity?number
Opacity of the other bars while hovering.
- Default
0.4
datareadonly T[]
Rows to plot.
dataKeySparklineDataKey<T>
Field (or accessor) holding the numeric value.
- Type
SparklineDataKey<T>
width?number
Fixed width in px. Omit to fill the parent width.
height?number
Height in px.
- Default
32
color?string
Series colour.
- Default
"var(--chart-line-primary)"
padding?number | Partial<SparklinePadding>
Inner padding so strokes and the hover dot are not clipped: one number for every side, or some sides. Defaults to 4 (2 for bars).
- Type
number | Partial<SparklinePadding>
yDomain?readonly [number?, number?]
Override the value domain; undefined entries fall back to the data.
animate?boolean
Play the enter animation on mount. Respects prefers-reduced-motion.
- Default
true
animationDuration?number
Enter duration in ms.
- Default
900
animationEasing?string
Any CSS easing string.
- Default
"cubic-bezier(0.85, 0, 0.15, 1)"
dataTransitionDuration?number
Morph to new data instead of snapping, in ms. 0 snaps. Requires animate; snaps under prefers-reduced-motion.
- Default
500
crosshair?SparklineCrosshair
Hover guide line. Set false to hide.
- Default
"dashed"
dot?boolean
Show a dot on the hovered point.
- Default
true
hoverTransition?boolean
Spring the crosshair and dot between points, like the main charts' tooltip. Snaps under prefers-reduced-motion.
- Default
true
springConfig?Partial<SparklineSpringConfig>
Hover spring for the crosshair and dot. Defaults to the main charts' tooltip spring (300 / 30); pass only what you want to change, e.g. { damping: 40 }. Higher stiffness = snappier; lower damping = bouncier.
- Type
Partial<SparklineSpringConfig>
interactive?boolean
Track the pointer and the keyboard (←/→, Home/End, Esc) to show the hovered point. false: no hover state, no listeners, no tab stop.
- Default
true
hoverIndex?number | null
Controlled hovered index. Pass null for "not hovering".
- Type
number | null
onHoverChange?(index: number | null, datum: T | null) => void
Called when the hovered point changes (pointer or keyboard), with its index and row, or null and null on leave.
- Type
(index: number | null, datum: T | null) => void
aria-label?string
Accessible summary. Generated from the data when omitted.
ariaLabel?string
Accessible summary (the kit's other charts' name for aria-label).
class?string
Extra class name for the sparkline's element.
style?CSSProperties
Inline style for the sparkline's element.
Examples
15 examples on Vue, each live with its code and its own install command.