shadcn.io is an independent project built on shadcn/ui
Installation
The command adds the example above to components/charts/ and, the first time, the chart kit to components/ui/charts/. Both are source files in your project from then on: read them, change them, delete what you don't use.
Usage
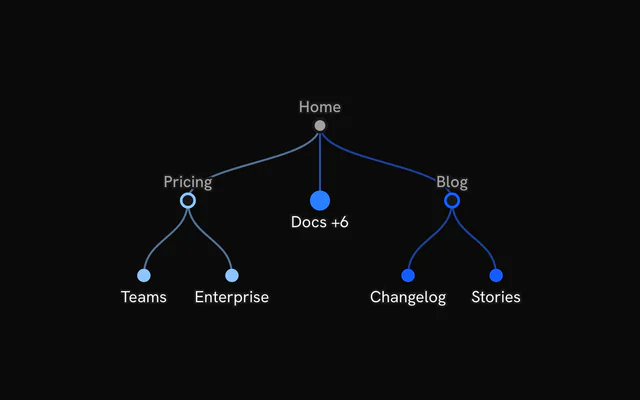
data is the root. Each node has a name and optional children, and a leaf's value adds up into its parents for the tooltip.
<script setup lang="ts">
import {
  ChartTooltip,
  TreeChart,
  TreeLabels,
  type TreeNode,
} from "@/components/ui/charts";

const data: TreeNode = {
  name: "Engineering",
  children: [
    {
      name: "Platform",
      children: [
        { name: "Infrastructure", value: 9 },
        { name: "Developer tools", value: 6 },
      ],
    },
    {
      name: "Product",
      children: [
        { name: "Web", value: 12 },
        { name: "Mobile", value: 8 },
        { name: "Growth", value: 5 },
      ],
    },
  ],
};
</script>

<template>
  <TreeChart ariaLabel="Engineering teams" :data="data" value-label="Engineers">
    <TreeLabels />
    <ChartTooltip />
  </TreeChart>
</template>
Anatomy
TreeChart lays out the nodes and links and draws them. TreeLabels names the nodes and ChartTooltip adds the panel, and either can be left out.
<TreeChart :data="data" layout="vertical" value-label="Engineers">
  <TreeLabels show-values />
  <ChartTooltip />
</TreeChart>TreeChart: Lays out the hierarchy, draws the dots and curved links, and folds branches.TreeLabels: Each node's name beside its dot, with leaf values if you ask for them.ChartTooltip: The hovered node's path, value and number of children.
Layouts
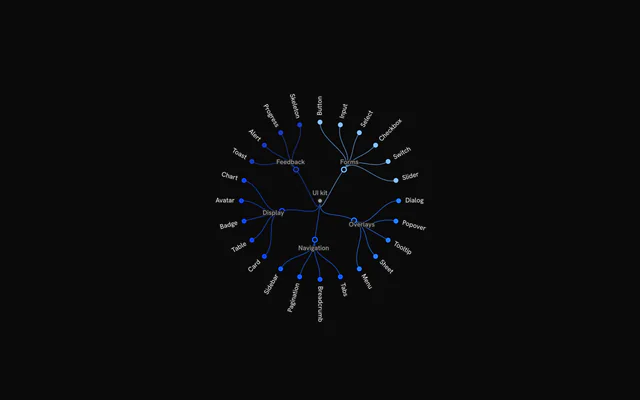
layout puts the root on the left ("horizontal"), at the top ("vertical") or in the middle ("radial"). A radial tree is square unless you set aspectRatio.
variant="cluster" draws a dendrogram, every leaf at the same depth, where the default tidy tree packs nodes as close as the shape allows.
Folding branches
Click a branch, or focus it and press Enter, and its children fold away. The other nodes glide to their new places, and the tooltip counts what's hidden.
defaultCollapsed lists the branches folded at first, by their path from the root's children: "Docs", or "Engineering/Platform" one level down. :collapsible="false" turns folding off.
Customization
The kit is in your project, in components/ui/charts/: your framework's components over a shared core/. Change a default there and every chart picks it up.
class goes on the chart's container, so size and spacing are utility classes.
content on ChartTooltip gets the node as point: its name, path, depth and value, its children and descendants counts, and whether it's collapsed.
Each top-level branch takes one color, from colors or --chart-1 to --chart-5 in order, and passes it down. Set color on a node to change it for that branch. nodeSize sets the dot's radius, 4.5 px by default.
<ChartTooltip>
  <template #content="{ point }">
    <TooltipBox>
      <div class="grid gap-1 px-3 py-2 text-sm">
        <span class="font-medium">{{ String(point.name) }}</span>
        <span class="text-muted-foreground">
          {{ Number(point.value) }} engineers
        </span>
      </div>
    </TooltipBox>
  </template>
</ChartTooltip>
Where a part renders content of its own, you pass it in. In Vue:
ChartTooltip:<template #content="{ point, index }">
Loading state
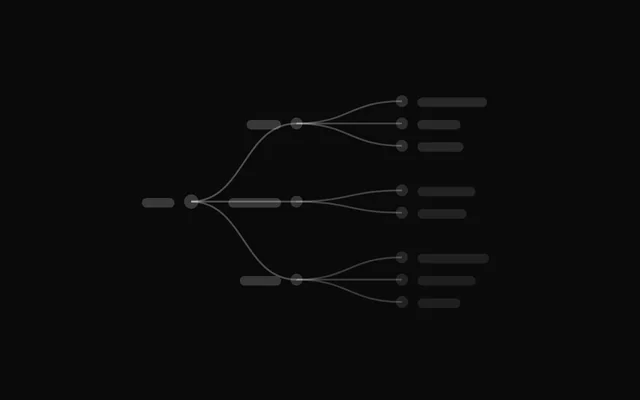
With status="loading" the chart draws muted dots and links in the shape of data, or a small stand-in tree without it, with short bars where the names go. On "ready" the real tree draws out from its root.
With nothing to pass yet, render <TreeChartLoading />. Give it the layout you'll use, such as layout="radial", so the placeholder matches.
Animation
Links draw out from the root and the nodes pop in after them, one depth at a time. Folding or unfolding a branch glides the remaining nodes to their new places.
:animate="false" skips the entrance, and so does reduced motion.
Theming
Every color in the kit is one of your theme's tokens or a mix of them, except --chart-positive, a fixed green. A preset or the .dark class restyles the chart, and overriding a token in your CSS changes it everywhere.
Branch dots are rings filled with --chart-background, your --card by default, and the names get a halo in it. On another surface, set it to that surface's color. Leaf names use the tooltip's text color and branch names --chart-label.
| Token | Default | Paints |
|---|---|---|
--chart-1 | your theme's | the first series |
--chart-2 | your theme's | the second series |
--chart-3 | your theme's | the third series |
--chart-4 | your theme's | the fourth series |
--chart-5 | your theme's | the fifth series |
--chart-background | --card | dot halos, the gaps between stacked marks |
--chart-label | --muted-foreground | tick labels |
--chart-tooltip-foreground | --popover-foreground | the tooltip's values |
:root {
  --chart-background: var(--background);
  --chart-label: var(--foreground);
}
Accessibility
The chart is an image named by ariaLabel, "Tree of" and the root's name unless you pass one. The keyboard reaches every node, and a focused node lights its path to the root as hover does.
- Tab
- Moves focus to the chart.
- Arrow Right
- Moves to the next node. ArrowDown does the same.
- Arrow Left
- Moves to the previous node. ArrowUp does the same.
- Home
- Jumps to the first node.
- End
- Jumps to the last node.
- Enter
- Folds or unfolds the focused branch. Space does the same.
API reference
Vue takes the same props as React, in camelCase or kebab-case, with class for className. Render props are scoped slots (#content), and callbacks such as onHoverChange can be written as listeners (@hover-change).
TreeChart
dataTreeNode
The tree's root.
variant?"tidy" | "cluster"
"tidy": each node beside its siblings, as compact as the tree allows (TanStack's tidy tree). "cluster": a dendrogram, every leaf at the same depth.
- Type
"tidy" | "cluster"- Default
"tidy"
layout?"horizontal" | "vertical" | "radial"
"horizontal": the root on the left, growing right. "vertical": the root on top. "radial": the root in the centre, growing out.
- Type
"horizontal" | "vertical" | "radial"- Default
"horizontal"
collapsible?boolean
Click (or Enter on) a branch to fold its children away, again to unfold them.
- Default
true
defaultCollapsed?readonly string[]
The paths (names joined with /, from the root's children: "Engineering/Platform") folded at first.
nodeSize?number
Radius of a node's dot, in px.
- Default
4.5
colors?readonly string[]
Colours of the top-level branches, in order (cycled). Defaults to --chart-1 … --chart-5.
formatValue?(value: number) => string
Formats a value in the tooltip.
- Type
(value: number) => string
valueLabel?string
The value's name in the tooltip.
- Default
"Value"
aspectRatio?string | number
Width over height: a number or a string such as "16 / 9".
- Type
string | number- Default
"16 / 9" (`"1 / 1"` radial)
height?number
A fixed height in px instead of an aspect ratio.
animate?boolean
Play the entrance: the links draw out from the root and the nodes pop in, depth by depth.
- Default
true
status?ChartStatus
"loading" draws a shimmering skeleton (muted nodes and links) in place of the chart and ignores the pointer; switching to "ready" plays the entrance. Switching back to "loading" fades the chart out first.
- Default
"ready"
loadingLabel?string
Text shown centered over the plot, with a shimmer, while status is "loading". Nothing is shown when it is unset or empty.
ariaLabel?stringariaDescription?stringclass?string
Extra class name for the chart's root element.
style?CSSProperties
Inline style for the chart's root element.
children?ReactNode
Carriers: ChartTooltip and the family's own.
TreeLabels
showValues?boolean
Show the leaves' values after their names.
- Default
false
ChartTooltip
showDatePill?boolean
Show the date pill that rides along the bottom of the plot.
- Default
true
showCrosshair?boolean
Show the vertical crosshair line. Bar charts leave it off unless this is true (the dots and the category pill mark the bar).
- Default
true
showDots?boolean
Show a dot on every series at the hovered position.
- Default
true
dotVariant?"dot" | "ring"
Dot style: a filled "dot" or a transparent "ring" square. Read by BarChart only.
- Type
"dot" | "ring"- Default
"dot"
dotSize?number
Dot radius in px.
- Default
5
dotRadiusFraction?number
Corner radius of the "ring" variant as a fraction of its side (0 is square, 0.5 is a circle). Read by BarChart only.
- Default
0.25
dotScale?number
Multiplier applied to the dot or ring size. Read by BarChart and LiveLineChart.
- Default
1
dotStrokeWidth?number
Stroke width of the dots in px.
- Default
2
indicatorColor?string | ((point: Record<string, unknown>) => string)
Color of the crosshair. Only a string is applied; the function form that bklit-ui accepts is ignored and the default is used.
- Type
string | ((point: Record<string, unknown>) => string)- Default
"var(--chart-crosshair)"
#content?slot: { point, index }
Replaces the default tooltip panel body. Receives the hovered data row and its index; with pinnable, also whether the panel is pinned and a dismiss that unpins it (for a close button in a pinned panel's detail).
pinnable?boolean
A click (or Enter, or Space) on the chart pins the tooltip where it is: the panel takes the pointer, so its content can grow into detail and hold controls, until another click, Escape or dismiss lets it go.
- Default
false
rows?(point: Record<string, unknown>) => { readonly color: string; readonly label: string; readonly value: string | number }[]
Replaces the default rows (one per series) with your own list of { color, label, value }.
- Type
(point: Record<string, unknown>) => { readonly color: string; readonly label: string; readonly value: string | number }[]
dotColor?string | ((point: Record<string, unknown>, line: ChartLineConfig) => string)
Fill of the tooltip dots. A function receives the hovered row and the series config, and is called again each time the hovered row changes. Defaults to each series' color; a ProfitLossLine's dot takes the color of the hovered value's sign.
- Type
string | ((point: Record<string, unknown>, line: ChartLineConfig) => string)
#default?slot
Extra content rendered below the rows in the default panel, for example marker details. Without it, a chart with ChartMarkers lists the markers on the hovered date there.
class?string
Extra class name for the tooltip panel.
springConfig?SpringConfig
Spring for the floating panel when matchCrosshair is on. Defaults to the chart's tooltip spring.
matchCrosshair?boolean
Make the floating panel follow the pointer with the same spring as the crosshair instead of damping.
- Default
false
damping?number
Spring damping for the floating panel when matchCrosshair is off, on bklit's 0 to 100 scale: lower is bouncier, higher slower, 0 moves the panel instantly. The default, 20, is the snappy hover spring (stiffness 3600, damping 120); every other value is bklit's spring for it played six times faster.
- Default
20
indicatorDasharray?string
Dash pattern of the crosshair. Omit for a solid line.
indicatorFadeEdges?IndicatorFadeEdges
Vertical fade of the crosshair: both ends, the top, the bottom, or none (solid).
- Default
"both"
indicatorFadeLength?number
Size of the crosshair's fade, as a percentage of its height (2 to 40).
- Default
10
indicatorEndColor?string
Bottom colour of the crosshair: it ramps from indicatorColor at the top to this at the bottom (composes with the fade).
indicatorEnd?"plot" | "point"
How far down the crosshair reaches: the whole plot, or down to the hovered point of the first series.
- Type
"plot" | "point"- Default
"plot"
dotHaloBlur?number
Blur in px on the dots' halo, for a soft glow.
- Default
0
topOffset?number
Extra gap in px between the top of the plot and the tooltip panel.
- Default
0
dateLabels?readonly string[]
The date pill's text for each data row, in row order (pair it with XAxis labels).
boxSpringConfig?SpringConfig
Spring for the floating panel. Takes priority over matchCrosshair and damping.
indicatorWidth?IndicatorWidth
Thickness of the crosshair: a width in px, or "line" (1px), "thin" (2px), "medium" (4px) or "thick" (8px).
- Default
"line"
TreeChartLoading
aspectRatio?string | number
Width over height: a number or a string such as "2 / 1". Defaults to the chart's own.
- Type
string | number
height?number
A fixed height in px instead of an aspect ratio.
label?string
Text shown centered over the skeleton, with a shimmer. Nothing is shown when it is unset or empty.
class?string
Extra CSS class name for the placeholder's root element.
- Default
""
layout?"horizontal" | "vertical" | "radial"
"horizontal": the root on the left, growing right. "vertical": the root on top. "radial": the root in the centre, growing out.
- Type
"horizontal" | "vertical" | "radial"- Default
"horizontal"
Examples
4 examples on Vue, each live with its code and its own install command.