shadcn.io is an independent project built on shadcn/ui
Installation
The command adds the example above to components/charts/ and, the first time, the chart kit to components/ui/charts/. Both are source files in your project from then on: read them, change them, delete what you don't use.
Usage
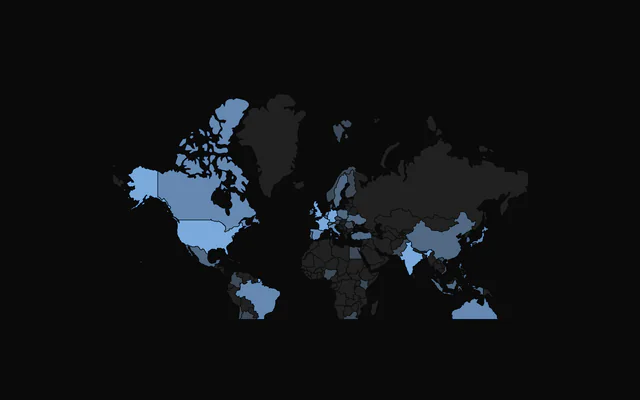
data is a GeoJSON FeatureCollection. TopoJSON needs converting first. The world map the examples use, worldCountries, installs beside them in components/charts/data/.
<script setup lang="ts">
import {
  ChoroplethChart,
  type ChoroplethFeature,
  ChoroplethFeatureComponent,
  ChoroplethTooltip,
} from "@/components/ui/charts";
import { worldCountries } from "@/components/charts/data/world-countries";

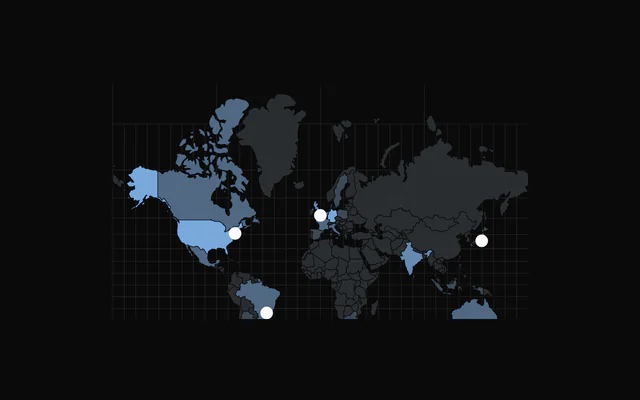
const signups: Record<string, number> = {
  Brazil: 1840,
  Canada: 2310,
  France: 2760,
  Germany: 3920,
  India: 4480,
  Japan: 1960,
  "United Kingdom": 3150,
  "United States of America": 9870,
};

const steps = [
  { color: "var(--chart-scale-05)", min: 4000 },
  { color: "var(--chart-scale-04)", min: 2000 },
  { color: "var(--chart-scale-03)", min: 1 },
];

const signupsOf = (feature: ChoroplethFeature) =>
  signups[feature.properties?.name ?? ""];

const colorOf = (feature: ChoroplethFeature) =>
  steps.find((step) => (signupsOf(feature) ?? 0) >= step.min)?.color ??
  "var(--muted)";
</script>

<template>
  <ChoroplethChart ariaLabel="Sign-ups by country" :data="worldCountries">
    <ChoroplethFeatureComponent :get-feature-color="colorOf" />
    <ChoroplethTooltip :get-feature-value="signupsOf" value-label="Sign-ups" />
  </ChoroplethChart>
</template>
Anatomy
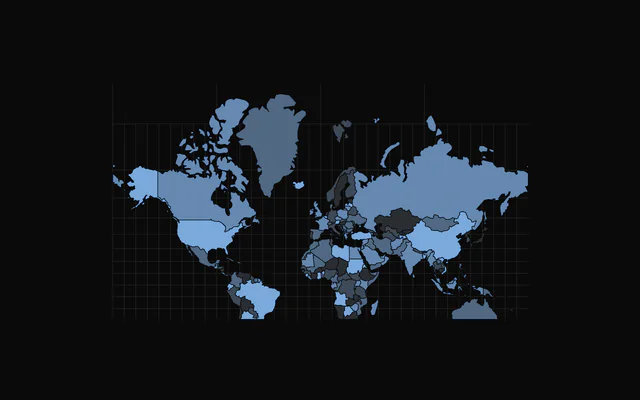
Draw the land with ChoroplethFeatureComponent for filled shapes or ChoroplethDotGrid for dots, then add the rest as you need it.
<ChoroplethChart click-to-zoom :data="worldCountries">
  <ChoroplethGraticule />
  <ChoroplethFeatureComponent :get-feature-color="colorOf" />
  <ChoroplethMarker :coordinates="[-0.13, 51.51]" label="London" />
  <ChoroplethTooltip :get-feature-value="valueOf" />
</ChoroplethChart>ChoroplethChart: Projects the GeoJSON and owns the zoom, the pan and the camera.ChoroplethFeatureComponent: Fills each country fromfill,getFeatureColoror a pattern.ChoroplethDotGrid: Draws the land, and the sea if you like, as a lattice of dots.ChoroplethGraticule: Lines of latitude and longitude, 10 degrees apart by default.ChoroplethMarker: A pin, dot or shape at a[longitude, latitude].ChoroplethBackground: A pattern behind the map that stays put while it pans and zooms.ChoroplethTooltip: The hovered country's name and, if you give one, its value.
Shading by value
getFeatureColor gets each feature and returns its color. Bucket the values into a few steps of --chart-scale-01 to --chart-scale-05 and give countries without data a muted fill, so they still read as land.
On the tooltip, getFeatureValue adds a value row and formatValue formats it. Return undefined and the row is hidden.
Zoom and pan
zoomEnabled adds wheel and pinch zoom and drag to pan, between zoomMin (0.5) and zoomMax (4). With clickToZoom, a click flies the camera to the country or marker under it, and a second click, a click on the sea or Escape flies back.
While zoomed in, only the focused country reacts to hover, and the others stay clickable. To move the camera from your own buttons, call useChoroplethCamera() in a component inside the chart.
A tilted camera
perspective tilts the map in 3D, with one view for the overview and one for a focused country. tilt leans it back and yaw turns it. view: "pointer" swings the overview as the pointer crosses the map, and view: "auto" looks at a focused country from its own side.
Markers
ChoroplethMarker places a circle, square, diamond, triangle or pin at a [longitude, latitude], and keeps its pixel size while the map zooms. pulse plays a ripple on hover or all the time, glow adds a soft halo, and showLabel writes the label beside it.
Dot grid
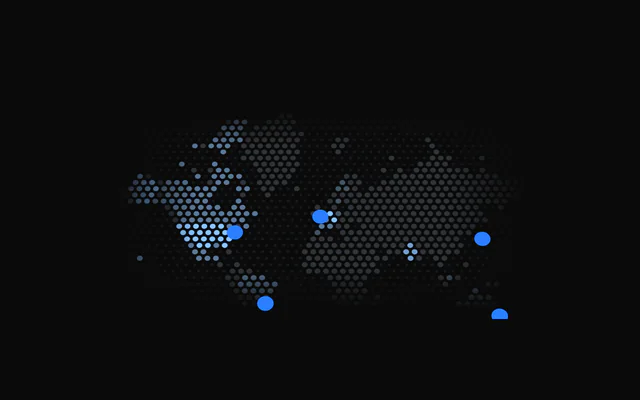
Swap ChoroplethFeatureComponent for ChoroplethDotGrid to draw the land as dots, colored per country with getFeatureColor. lattice picks hex or square spacing, and the sea gets fainter, smaller dots unless you set :showOcean="false".
The dots grow as the camera zooms in, up to zoomDotSize, and edgeFade softens the grid into the frame.
Patterns
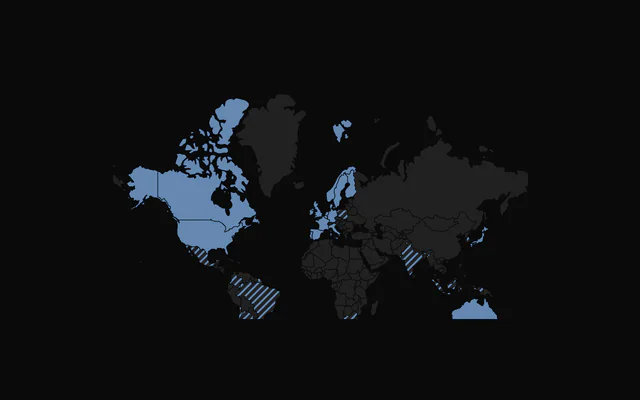
Put SVG patterns in patterns on ChoroplethFeatureComponent and return a pattern's id from getFeaturePattern. Countries that get null keep their color.
Customization
The kit is in your project, in components/ui/charts/: your framework's components over a shared core/. Change a default there and every chart picks it up.
class goes on the chart's container, so size and spacing are utility classes.
The tooltip shows the feature's properties.name. getFeatureName renames it, and content replaces what the panel says: it gets the feature and its index.
The projection is Mercator, centered on [0, 20]. Move it with center, scale and translate, for example to frame one continent.
<ChoroplethTooltip>
  <template #content="{ feature }">
    <div class="grid gap-1">
      <span class="font-medium">{{ feature.properties?.name }}</span>
      <span class="text-muted-foreground">
        {{ (signupsOf(feature) ?? 0).toLocaleString("en-US") }} sign-ups
      </span>
    </div>
  </template>
</ChoroplethTooltip>
Where a part renders content of its own, you pass it in. In Vue:
ChoroplethTooltip:<template #content="{ feature, index }">
Loading state
The map has no loading state. The shapes ship with your code, so what you usually wait for is the values: render the map with one neutral fill until they arrive, then switch to getFeatureColor.
Animation
The countries fade in over animationDuration, 800 ms by default, and enterTransition swaps the curve. Camera flights take zoomTransition: 700 ms on an ease-in-out unless you set a duration and an ease.
With reduced motion the camera jumps instead of flying, the pointer camera holds still and markers stop pulsing.
Theming
Every color in the kit is one of your theme's tokens or a mix of them, except --chart-positive, a fixed green. A preset or the .dark class restyles the chart, and overriding a token in your CSS changes it everywhere.
Without fill or getFeatureColor, countries cycle through --chart-scale-01 to --chart-scale-05. Borders take your --background, and the graticule and background pattern take --chart-grid.
| Token | Default | Paints |
|---|---|---|
--chart-scale-01 | --chart-1 at 10% over --muted | the low end of a color scale |
--chart-scale-05 | --chart-1 | the high end of a color scale |
--chart-1 | your theme's | the first series |
--chart-grid | --border | grid lines |
--chart-tooltip-background | --popover | the tooltip panel |
--chart-tooltip-foreground | --popover-foreground | the tooltip's values |
:root {
  --chart-grid: var(--muted);
  --chart-tooltip-background: var(--card);
}
Accessibility
The map is an image named by ariaLabel ("Choropleth chart" by default). A reader can't scan a map for the answer, so put it in ariaDescription: the top countries and their values.
The arrow keys step through the countries from west to east, skipping any too small to see at the current zoom. With clickToZoom, each marker is also a button ("Zoom to London") that Tab reaches and Enter flies to. Zooming into a country takes a pointer.
- Tab
- Moves focus to the map, then to each marker when
clickToZoomis on. - Arrow Right
- Moves to the next country east. ArrowDown does the same.
- Arrow Left
- Moves to the next country west. ArrowUp does the same.
- Home
- Jumps to the westernmost country.
- End
- Jumps to the easternmost country.
- Enter
- On a marker, flies the camera to it. Space does the same.
- Escape
- Flies the camera back out after a zoom.
API reference
Vue takes the same props as React, in camelCase or kebab-case, with class for className. Render props are scoped slots (#content), and callbacks such as onHoverChange can be written as listeners (@hover-change).
ChoroplethChart
dataFeatureCollection<Geometry, ChoroplethFeatureProperties>
GeoJSON FeatureCollection to draw, with one feature per region. Pass GeoJSON objects: TopoJSON is not read, so convert it first (for example with topojson-client's feature()).
- Type
FeatureCollection<Geometry, ChoroplethFeatureProperties>
margin?Partial<Margin>
Chart margins in pixels. Any side you omit keeps its default.
- Type
Partial<Margin>- Default
{ top: 0, right: 0, bottom: 0, left: 0 }
animationDuration?number
Duration of the enter animation in milliseconds.
- Default
800
enterTransition?EnterTransition
Enter transition (a spring or a cubic-bezier tween), in seconds.
- Default
a tween of `animationDuration` on the reveal curve
revealSignature?string
Changing this value replays the enter animation.
- Default
""
aspectRatio?string
Aspect ratio of the chart as "width / height".
- Default
"16 / 9"
scale?number
Projection scale of the Mercator projection. When omitted it follows the chart width.
center?[number, number]
Geographic center of the map as [longitude, latitude].
- Default
[0, 20]
translate?[number, number]
Pixel offset of the projection center as [x, y]. When omitted the map is centered in the chart.
zoomEnabled?boolean
Enable zoom and pan with the mouse wheel, pinch, and drag.
- Default
false
zoomMin?number
Minimum zoom scale.
- Default
0.5
zoomMax?number
Maximum zoom scale.
- Default
4
initialZoom?TransformMatrix
Initial zoom transform.
- Default
the identity transform (no zoom, no pan)
class?string
Additional class name for the chart container.
- Default
""
clickToZoom?boolean
Click a region or a marker to fly the camera to it; click it again, the empty map, or press Escape to fly back.
- Default
false
focusMaxZoom?number
Largest camera scale when it frames a region.
- Default
6
zoomTransition?ChoroplethZoomTransition
Duration and easing of the click-to-zoom flight and of the camera's angle changes.
- Default
{ duration: 700, ease: [0.83, 0, 0.17, 1] }
perspective?ChoroplethPerspective
A 3D camera: one view for the zoomed-out map and one for a focused region (for example flat, swinging to look from the east once you zoom in).
childrenReactNode
ChoroplethFeatureComponent or ChoroplethDotGrid, ChoroplethGraticule, ChoroplethMarker, ChoroplethBackground and ChoroplethTooltip to configure the map, plus any elements that call useChoropleth(), useChoroplethZoom() or useChoroplethCamera().
ariaLabel?string
Accessible label of the chart.
- Default
"Choropleth chart"
ariaDescription?string
Longer accessible description of the chart.
ChoroplethFeatureComponent
fill?string
Solid fill color for every feature. Takes precedence over getFeatureColor.
- Default
a cycle of the `--chart-scale-01` to `--chart-scale-05` variables, by feature index
stroke?string
Border color of the features.
- Default
"var(--bkm-background)"
strokeWidth?number
Border width of the features in pixels.
- Default
0.5
fadedOpacity?number
Opacity of the other features while one is hovered or focused.
- Default
0.4
getFeatureColor?(feature: ChoroplethFeature, index: number) => string
Returns a fill color per feature. Used when fill is not set.
- Type
(feature: ChoroplethFeature, index: number) => string
#patterns?slot
Pattern definitions (SVG <pattern> elements) that features can reference by id through getFeaturePattern.
getFeaturePattern?(feature: ChoroplethFeature, index: number) => string | null | undefined
Returns the id of a pattern to fill a feature with, or null/undefined to use the color. A pattern wins over fill and getFeatureColor.
- Type
(feature: ChoroplethFeature, index: number) => string | null | undefined
ChoroplethDotGrid
gap?number
Distance between dot centres in pixels.
- Default
7
dotSize?number
Dot diameter as a fraction of gap (0 to 1).
- Default
0.7
zoomDotSize?number
Dot diameter (a fraction of gap) at the camera's largest zoom: the dots grow toward it as the camera zooms in.
- Default
0.9
hideOceanOnFocus?boolean
Fade the ocean dots out while the camera is focused on a region.
- Default
true
lattice?ChoroplethDotLattice
The lattice: "hex" offsets every other row, "square" is a plain grid.
- Default
"hex"
showOcean?boolean
Draw the grid over the oceans too, so the whole map is one dot field.
- Default
true
oceanColor?string
Color of the ocean dots.
- Default
"var(--chart-scale-01)"
oceanOpacity?number
Opacity of the ocean dots.
- Default
0.55
oceanDotScale?number
Size of the ocean dots relative to the land dots.
- Default
0.55
edgeFade?number
Fade the grid out toward the map's edges, as a percent of its width and height per side; 0 keeps hard edges.
- Default
12
fill?string
One color for every region's dots. Takes precedence over getFeatureColor.
getFeatureColor?(feature: ChoroplethFeature, index: number) => string
Returns the dot color of a region.
- Type
(feature: ChoroplethFeature, index: number) => string
fadedOpacity?number
Opacity of the other regions while one is hovered.
- Default
0.4
ChoroplethGraticule
stroke?string
Color of the graticule lines.
- Default
"var(--chart-graticule)", the theme's `--border`
strokeWidth?number
Width of the graticule lines in pixels.
- Default
0.5
step?[number, number]
Spacing of the lines as [longitude, latitude] in degrees.
- Default
[10, 10]
hideOnFocus?boolean
Fade the lines out while the camera is focused on a region or a marker.
- Default
true
ChoroplethMarker
coordinates[number, number]
Where the marker sits, as [longitude, latitude].
labelstring
Name shown in the tooltip (and beside the marker with showLabel).
shape?ChoroplethMarkerShape
The marker's shape.
- Default
"circle"
size?number
Size in pixels; it stays this size while the map zooms.
- Default
9
color?string
Fill color.
- Default
"var(--foreground)"
stroke?string
Outline color; without it the marker has no outline.
strokeWidth?number
Outline width in pixels (with stroke).
- Default
1.5
pulse?ChoroplethMarkerPulse
The ripple ring: off, while hovered or focused, or always. Reduced motion turns it off.
- Default
"hover"
glow?number
Blur of a soft outer glow, in pixels; 0 turns it off.
- Default
0
showLabel?boolean
Always draw the label beside the marker.
- Default
false
class?string
Additional class name for the marker's group.
ChoroplethBackground
pattern?PatternPresetId
Pattern preset. "none" draws nothing.
- Default
"diagonal"
color?string
Color of the pattern strokes.
- Default
"var(--chart-grid)"
showFill?boolean
Draw the pattern.
- Default
true
opacity?number
Opacity of the pattern.
- Default
1
fadeHorizontal?boolean
Fade the pattern out at the left and right edges.
- Default
true
fadeVertical?boolean
Fade the pattern out at the top and bottom edges.
- Default
true
fadeHorizontalLength?number
Width of the horizontal fade zone, as a percent of the chart's width per edge (0 to 45).
- Default
10
fadeVerticalLength?number
Height of the vertical fade zone, as a percent of the chart's height per edge (0 to 45).
- Default
10
hideOnFocus?boolean
Fade the pattern out while the camera is focused.
- Default
false
scale?number
Multiplies the tile size; the line width scales with it. 2 doubles it.
- Default
1
strokeWidth?number
Line width of the line presets, in tile units (multiplied by scale).
- Default
1
tileBackground?string
Solid colour painted under the pattern in each tile.
radius?number
Deprecated: No effect: only the earlier circle presets read it..
complement?boolean
Deprecated: No effect: only the earlier circle presets read it..
fill?string
Deprecated: No effect: only the earlier circle presets read it..
dotFill?boolean
Deprecated: No effect: only the earlier dot preset read it..
ChoroplethTooltip
#content?slot: { feature, index }
Custom tooltip content for a feature. Replaces the default name and value.
formatValue?(value: number) => string
Formats the value in the default tooltip.
- Type
(value: number) => string- Default
integer formatting
getFeatureName?(feature: ChoroplethFeature, index: number) => string
Returns the tooltip title of a feature.
- Type
(feature: ChoroplethFeature, index: number) => string- Default
the feature's `properties.name`, or "Feature <index>"
getFeatureValue?(feature: ChoroplethFeature, index: number) => number | undefined
Returns the value shown for a feature. When it returns undefined the value row is hidden.
- Type
(feature: ChoroplethFeature, index: number) => number | undefined
valueLabel?string
Label of the value row.
- Default
"Value"
class?string
Additional class name for the tooltip panel.
panelStyle?CSSProperties
Inline styles for the tooltip panel, for example a blur or border.
backgroundColor?string
Background color of the tooltip panel (a CSS variable or a color).
hideDelay?number
Grace period in milliseconds before the tooltip hides when the pointer leaves a feature for the sea or a border gap: a move onto the next feature within it carries the panel over instead of fading it out and back in.
- Default
120
Examples
9 examples on Vue, each live with its code and its own install command.