shadcn.io is an independent project built on shadcn/ui
Installation
The command adds the example above to components/charts/ and, the first time, the chart kit to components/ui/charts/. Both are source files in your project from then on: read them, change them, delete what you don't use.
Usage
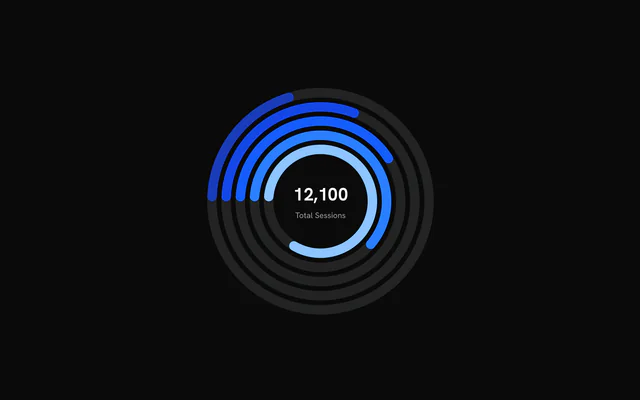
Each item needs a label, a value and the maxValue that fills its ring. Rings are drawn from the inside out, in the order of data.
<script setup lang="ts">
import { Ring, RingCenter, RingChart } from "@/components/ui/charts";

const data = [
  { label: "Running", maxValue: 30, value: 24 },
  { label: "Cycling", maxValue: 60, value: 41 },
  { label: "Swimming", maxValue: 20, value: 9 },
];
</script>

<template>
  <RingChart
    ariaLabel="Training hours against monthly goals"
    :data="data"
    :size="240"
  >
    <Ring v-for="(item, index) in data" :key="item.label" :index="index" />
    <RingCenter default-label="Hours" />
  </RingChart>
</template>
Anatomy
The rings come from data, the first item innermost. Everything else is a child you add: a grid behind the rings, their names, a number in the middle.
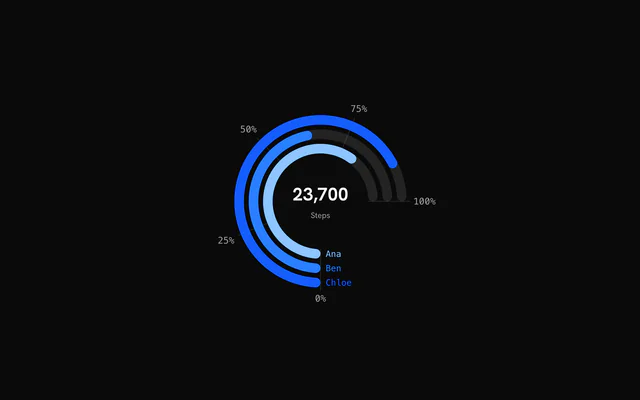
<RingChart :data="data" :end-angle="Math.PI / 2" :start-angle="-Math.PI">
  <RingGrid />
  <Ring :index="0" />
  <Ring :index="1" line-cap="butt" />
  <RingLabels color-by-ring />
  <RingCenter default-label="Steps" />
</RingChart>RingChart: Draws one ring per item ofdata, each filled tovalue / maxValueof its track.RingGrid: Spokes across the rings at progress ticks, labeled outside the arc. Place it before the rings.Ring: Overrides one ring byindex: itscolor,lineCaporanimate.RingLabels: Each ring's name, set just before the point where it starts.RingCenter: The sum of everyvalueat rest, the hovered ring's value and label on hover.
Arcs and half rings
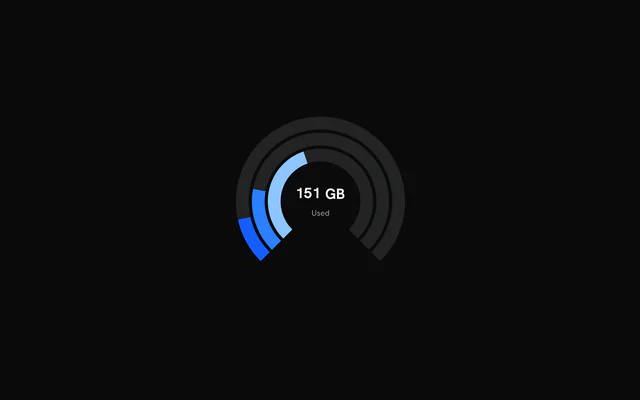
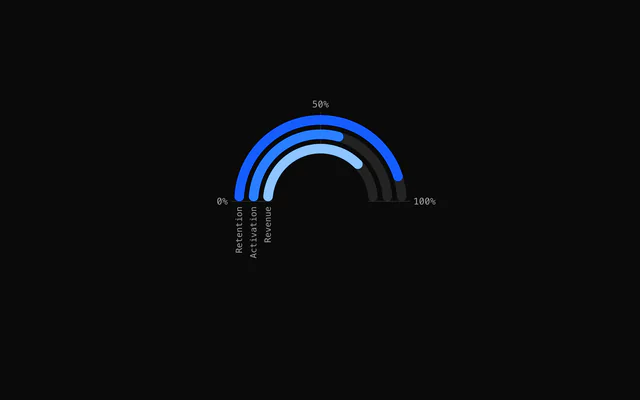
startAngle and endAngle set the sweep in radians, clockwise from 12 o'clock. The default is a full turn starting at 9 o'clock. -(3 * Math.PI) / 4 to (3 * Math.PI) / 4 leaves the bottom quarter open, as in this example.
Pass lineCap="butt" to a <Ring> for square ends.
Progress grid and labels
<RingGrid /> draws a spoke across the rings at each quarter of the way to maxValue and labels it past the outer ring. :ticks="[0, 0.5, 1]" picks your own fractions, and tickFormat writes their labels.
<RingLabels /> names each ring just before its start, so it needs a gap in the circle: a three-quarter arc or a half ring. With a grid, the chart keeps 32 px around the rings for the labels instead of 8.
Different targets
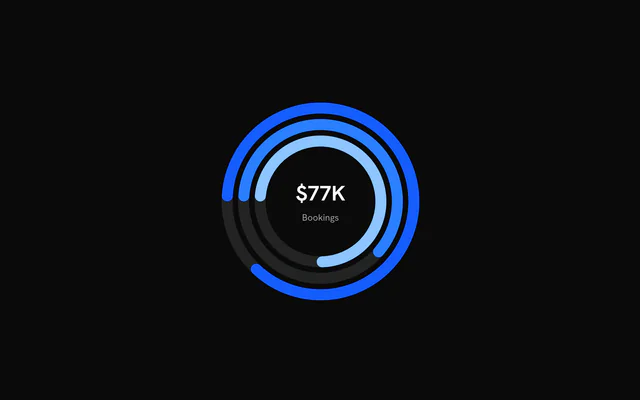
Rings don't have to share a target. Give each item its own maxValue and the fills stay comparable as percentages while the center adds up the raw values.
Format that total with formatOptions (any Intl.NumberFormat options, such as compact currency), prefix and suffix.
With a legend
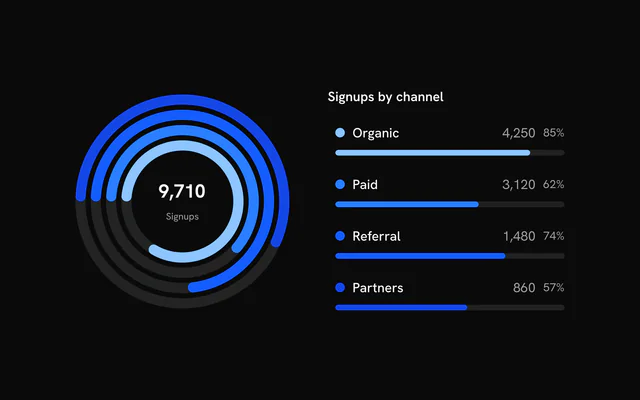
A hovered ring grows by 3% and the others fade. hoveredIndex and onHoverChange make that hover controlled, so a <Legend> given the same state lights up the matching ring, and the ring lights up its row.
LegendProgress in a row draws a bar from the item's value and maxValue, the same numbers the ring uses.
Customization
The kit is in your project, in components/ui/charts/: your framework's components over a shared core/. Change a default there and every chart picks it up.
class goes on the chart's container, so size and spacing are utility classes.
Ring geometry is three props in pixels: strokeWidth (12), ringGap (6) and baseInnerRadius (60). When they don't fit in size, every ring scales down by the same factor. Leave size out and the chart takes its container's width and stays square.
For the hovered state of the center, give RingCenter a function as its child. It receives value, label and the ring's data, so it can show progress against that ring's own maxValue. At rest the total still shows.
<RingCenter default-label="Booked">
  <template #default="{ data, label, value }">
    <div class="text-center">
      <div class="font-semibold text-2xl tabular-nums">
        {{ Math.round((value / data.maxValue) * 100) }}%
      </div>
      <div class="text-muted-foreground text-xs">{{ label }}</div>
    </div>
  </template>
</RingCenter>
Where a part renders content of its own, you pass it in. In Vue:
RingCenter:<template #default="{ value, label, isHovered, data }">
Loading state
The ring chart has no loading state of its own. While the numbers load, render a round Skeleton at the chart's size in its place, so the card doesn't jump when the rings mount.
Animation
Each track scales up from the center, one ring after the next, and its fill sweeps round from the start angle. enterTransition takes a motion-style transition (a 1.1 s tween unless you pass one), and enterStaggerScale stretches the delay between rings: 0 starts them together.
:animate="false" on a Ring draws that ring filled from the first frame. With reduced motion turned on, the fills appear at their values without the sweep.
Theming
Every color in the kit is one of your theme's tokens or a mix of them, except --chart-positive, a fixed green. A preset or the .dark class restyles the chart, and overriding a token in your CSS changes it everywhere.
Rings take --chart-1 to --chart-5 in order, then repeat. Set color on a data item or on its <Ring> to choose one.
The empty tracks are your theme's --border. RingGrid draws its spokes in --chart-foreground at 20% opacity, and its labels, like RingLabels, in --chart-label.
| Token | Default | Paints |
|---|---|---|
--chart-1 | your theme's | the first series |
--chart-2 | your theme's | the second series |
--chart-3 | your theme's | the third series |
--chart-4 | your theme's | the fourth series |
--chart-5 | your theme's | the fifth series |
--chart-label | --muted-foreground | tick labels |
:root {
  --chart-label: var(--foreground);
}
Accessibility
The chart is an image named by ariaLabel ("Ring chart" by default). Rings show progress but not what it measures, so put the goal in the name or in ariaDescription.
Keyboard focus behaves like hover: the focused ring grows, the others fade, and RingCenter shows its value and label.
- Tab
- Moves focus to the chart and highlights the innermost ring.
- Arrow Right
- Moves to the next ring out. ArrowDown does the same.
- Arrow Left
- Moves to the next ring in. ArrowUp does the same.
- Home
- Jumps to the innermost ring.
- End
- Jumps to the outermost ring.
API reference
Vue takes the same props as React, in camelCase or kebab-case, with class for className. Render props are scoped slots (#content), and callbacks such as onHoverChange can be written as listeners (@hover-change).
RingChart
dataRingData[]
The rings to draw, from the innermost outwards. Each ring fills value / maxValue of its track.
size?number
Chart width and height in pixels. Omit to fill the width of the parent element; the chart stays square.
strokeWidth?number
Thickness of each ring in pixels.
- Default
12
ringGap?number
Gap between neighbouring rings in pixels.
- Default
6
baseInnerRadius?number
Inner radius of the innermost ring in pixels. Also sets the size of the area available to RingCenter.
- Default
60
padding?number
Space kept clear between the outermost ring and the chart's edge, in pixels. The rings scale down to keep it.
- Default
8, or 32 with a `RingGrid` (room for its labels)
class?string
Extra class name for the chart container.
style?CSSProperties
Inline styles for the chart container, merged over the default sizing.
hoveredIndex?number | null
Index of the hovered ring, for controlled hover. Pass null for no hover; leave it undefined to let the chart manage hover itself.
- Type
number | null
onHoverChange?(index: number | null) => void
Called with the index of the hovered or keyboard-focused ring, or null when hover ends.
- Type
(index: number | null) => void
startAngle?number
Angle where every ring starts, in radians, clockwise from 12 o'clock (d3's convention): the default -Math.PI / 2 is 9 o'clock. bklit-ui's own comment calls the default "top", but its d3 arcs start at 9 o'clock too.
- Default
-Math.PI / 2
endAngle?number
Angle where a full ring ends, in radians. Together with startAngle this sets the sweep; the default is a full circle.
- Default
(3 * Math.PI) / 2
enterTransition?RingEnterTransition
Transition for the entrance, in the shape used by the motion library (type, duration in seconds, ease, and spring values). Defaults to a 1.1 second tween on the shared reveal curve.
enterStaggerScale?number
Multiplier for the delay between one ring's entrance and the next. 0 starts all rings together.
- Default
1
geometryScrubbing?boolean
Turns off hover effects and Ring overrides. Meant for live editors that redraw the geometry while a control is dragged; leave it off otherwise.
- Default
false
childrenReactNode
Ring elements to configure individual rings and an optional RingCenter.
ariaLabel?string
Accessible name of the chart.
- Default
"Ring chart"
ariaDescription?string
Longer accessible description of the chart.
Ring
indexnumber
Index of the ring this element configures, matching its position in the data array.
color?string
Colour override for this ring. Takes precedence over the data item's color.
animate?boolean
Play the entrance animation for this ring. Set false to draw it without animating.
- Default
true
lineCap?RingLineCap
Shape of the ring's leading end: "round" or "butt" (square).
- Default
"round"
RingCenter
defaultLabel?string
Label shown under the total while no ring is hovered. A hovered ring shows its own label instead.
- Default
"Total"
formatOptions?CenterStatFormat
Number format for the centre value, in Intl.NumberFormat terms (notation, currency, fraction digits and so on).
- Default
{ maximumFractionDigits: 0, notation: "standard" }
#default?slot: { value, label, isHovered, data }
Render function for custom centre content. It is called with { value, label, isHovered, data } while a ring is hovered; when nothing is hovered the default total is shown.
- Type
slot: { value, label, isHovered, data }
class?string
Extra class name for the centre container.
valueClassName?string
Class name for the value text.
labelClassName?string
Class name for the label text.
prefix?string
Text shown before the value, for example "$".
suffix?string
Text shown after the value, for example "%".
RingGrid
ticks?number | readonly number[]
Progress ticks: fractions of each ring's maxValue (0 to 1), or the number of equal intervals. On a full circle the 100% tick lands on 0% and only 0% is drawn.
- Type
number | readonly number[]- Default
4
tickFormat?(fraction: number) => string
Formats a tick's label from its fraction.
- Type
(fraction: number) => string- Default
whole percent, "25%"
showSpokes?boolean
Draw spokes across the rings at every tick.
- Default
true
showLabels?boolean
Draw the tick labels along the outer edge of the arc.
- Default
true
stroke?string
Spoke colour.
- Default
"var(--chart-foreground)"
strokeOpacity?number
Spoke opacity.
- Default
0.2
tickLength?number
How far a spoke runs past the outermost ring, in pixels.
- Default
4
labelColor?string
Tick label colour.
- Default
"var(--chart-label)"
fontSize?number
Tick label font size in pixels. Defaults to a size that follows the chart's (9 to 12).
labelOffset?number
Gap between a spoke's end and its label, in pixels.
- Default
4
RingLabels
format?(data: RingData, index: number) => string
Each ring's label text. Defaults to its data item's label.
- Type
(data: RingData, index: number) => string
colorByRing?boolean
Colour each label like its ring instead of the muted label colour.
- Default
false
color?string
Label colour while colorByRing is off.
- Default
"var(--chart-label)"
fontSize?number
Font size in pixels. Defaults to a size that follows the ring width (9 to 12).
offset?number
Distance in pixels before each ring's start. Defaults to 0.6 times the font size.
Examples
6 examples on Vue, each live with its code and its own install command.