shadcn.io is an independent project built on shadcn/ui
Installation
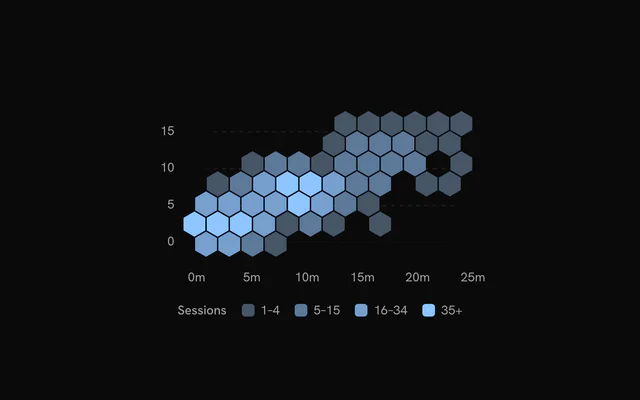
The command adds the example above to components/charts/ and, the first time, the chart kit to components/ui/charts/. Both are source files in your project from then on: read them, change them, delete what you don't use.
Usage
Each row is one observation, with a number under xDataKey and one under yDataKey. Rows missing either are skipped.
<script setup lang="ts">
import {
  HexbinCells,
  HexbinChart,
  HexbinTooltip,
  HexbinXAxis,
  HexbinYAxis,
} from "@/components/ui/charts";

const sessions = [
  { minutes: 1.4, pages: 2 },
  { minutes: 2.2, pages: 3 },
  { minutes: 2.6, pages: 2 },
  { minutes: 6.8, pages: 7 },
  { minutes: 9.1, pages: 6 },
];
</script>

<template>
  <HexbinChart
    ariaLabel="Session length and pages viewed"
    :data="sessions"
    x-data-key="minutes"
    y-data-key="pages"
  >
    <HexbinCells />
    <HexbinXAxis />
    <HexbinYAxis />
    <HexbinTooltip value-label="Sessions" />
  </HexbinChart>
</template>
Anatomy
The cells always draw over the grid, whatever order you write the children in. Leave out the axes, tooltip or legend and they aren't drawn.
<HexbinChart :data="data" x-data-key="minutes" y-data-key="pages">
  <HexbinGrid />
  <HexbinCells />
  <HexbinXAxis />
  <HexbinYAxis />
  <HexbinTooltip value-label="Sessions" />
  <HexbinLegend title="Sessions" />
</HexbinChart>HexbinChart: Holds the observations and sets up the x and y scales.HexbinGrid: Dashed guide lines, horizontal unless you addvertical.HexbinCells: The hexagons.binWidthsets their size,valueDataKeyandreducewhat their color shows.HexbinXAxis: Tick labels along the bottom.HexbinYAxis: Tick labels on the left.HexbinTooltip: The hovered bin's position and value.HexbinLegend: One swatch per color step and the range it covers, under the plot.
Bin size
binWidth on <HexbinCells> is the distance between neighboring hexagon centers, 22 px by default. Points are binned in pixels after the chart is sized, so a narrow chart puts more of them in each bin.
That keeps the hexagons a readable size on a phone. If you need the same bins at every width, aggregate the data yourself and use a heatmap.
Sums and averages
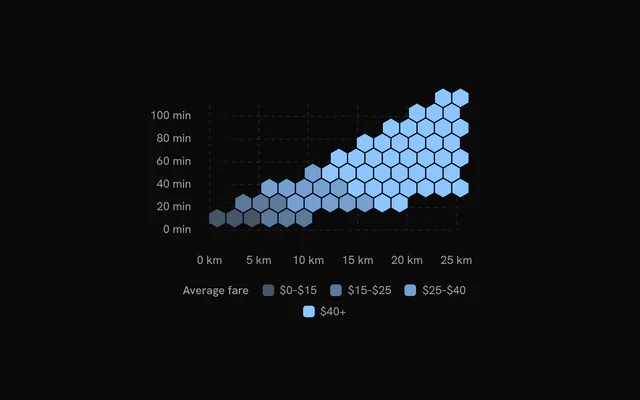
By default a bin's color is its count. Point valueDataKey at a field and each bin sums it, or averages it with reduce="mean". The tooltip then shows the value and the count.
Format the value with formatValue on both <HexbinTooltip> and <HexbinLegend> so they agree.
Tooltip content
The default panel is titled with the bin's center, in the axes' formats, and lists its value. valueLabel renames that row and formatPosition rewrites the title.
For anything else, pass content. It gets the hovered bin with its x, y, count, value and the rows that fell in it, and renders inside the same panel.
Customization
The kit is in your project, in components/ui/charts/: your framework's components over a shared core/. Change a default there and every chart picks it up.
class goes on the chart's container, so size and spacing are utility classes.
Fills come in steps, four by default, from --chart-scale-02 to --chart-scale-05. The cut points sit on a square-root scale, so a few crowded bins don't push the rest into the lightest step.
To choose them yourself, pass colors and thresholds (one fewer). gap sets the space between hexagons and stroke gives them an outline. The legend reads whatever you pass.
<HexbinCells
  :colors="[
    'var(--chart-scale-02)',
    'var(--chart-scale-04)',
    'var(--chart-scale-05)',
  ]"
  :gap="0"
  :thresholds="[5, 20]"
/>
Where a part renders content of its own, you pass it in. In Vue:
HexbinTooltip:<template #content="{ bin, index }">
Loading state
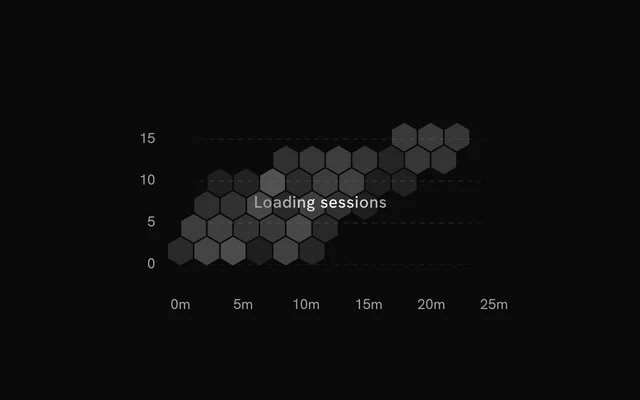
Pass status="loading" and a patch of skeleton hexagons shimmers in the plot, while the axes and grid stay put. The pointer is ignored until you switch to "ready", then the real bins sweep in.
There's no separate placeholder. With no rows yet, pass an empty data array along with xDomain and yDomain, so the axes don't change when the data lands.
Animation
The hexagons grow in as a wave from left to right. The wave takes animationDuration (900 ms) to cross the plot and each hexagon 450 ms to settle.
New data doesn't replay it. Change revealSignature when you want the wave again, say after a filter changes. :animate="false" and reduced motion both draw the bins at rest.
Theming
Every color in the kit is one of your theme's tokens or a mix of them, except --chart-positive, a fixed green. A preset or the .dark class restyles the chart, and overriding a token in your CSS changes it everywhere.
The default fills are mixes of --chart-1 into --muted, so changing --chart-1 recolors the whole scale. The hovered hexagon is redrawn slightly larger with a --chart-foreground outline.
| Token | Default | Paints |
|---|---|---|
--chart-1 | your theme's | the first series |
--chart-scale-05 | --chart-1 | the high end of a color scale |
--chart-grid | --border | grid lines |
--chart-label | --muted-foreground | tick labels |
--chart-tooltip-background | --popover | the tooltip panel |
:root {
  --chart-grid: var(--muted);
  --chart-label: var(--foreground);
}
Accessibility
The chart is announced as an image named by ariaLabel ("Hexbin chart" by default). The bins carry no text, so put the pattern a reader should notice in ariaDescription.
Each bin takes keyboard focus in turn, left to right, and shows its tooltip as it does on hover. On a touch screen, tap a bin.
- Tab
- Moves focus to the chart, on its leftmost bin.
- Arrow Right
- Moves to the next bin to the right. ArrowDown does the same.
- Arrow Left
- Moves to the previous bin. ArrowUp does the same.
- Home
- Jumps to the leftmost bin.
- End
- Jumps to the rightmost bin.
API reference
Vue takes the same props as React, in camelCase or kebab-case, with class for className. Render props are scoped slots (#content), and callbacks such as onHoverChange can be written as listeners (@hover-change).
HexbinChart
datareadonly SpatialRow[]
The observations to bin: one row per point. Rows without a finite x or y are left out.
xDataKeystring
Key of the horizontal value in each row.
yDataKeystring
Key of the vertical value in each row.
xDomain?readonly [number, number]
The x range shown. Defaults to the data's, rounded out to nice values.
yDomain?readonly [number, number]
The y range shown. Defaults to the data's, rounded out to nice values.
aspectRatio?string
Aspect ratio of the chart as "width / height".
- Default
"16 / 9"
margin?Partial<SpatialMargin>
Space around the plot in pixels. Any side you omit keeps its default.
- Type
Partial<SpatialMargin>
animate?boolean
Play the entrance animation.
- Default
true
animationDuration?number
Length of the entrance sweep in milliseconds: the time from the first mark starting to the last one.
- Default
900
revealSignature?string
Changing this value replays the entrance animation.
status?ChartStatus
"loading" draws a pulsing skeleton of the chart's shape in place of its marks (the axes, grid and land stay) and ignores the pointer; switching to "ready" plays the entrance.
- Default
"ready"
loadingLabel?string
Text shown centered over the chart, with a shimmer, while status is "loading". Nothing is shown when it is unset or empty.
class?string
Additional class name for the chart container.
children?ReactNode
The chart's carriers: its layers, axes, grid, tooltip and legend.
ariaLabel?string
Accessible label of the chart.
ariaDescription?string
Longer accessible description of the chart.
HexbinCells
binWidth?number
Horizontal distance between neighbouring bin centers, in pixels. Bins are laid out at the chart's size, so a narrower chart groups more observations per bin.
- Default
22
valueDataKey?string
Key of a value to combine per bin (with reduce) instead of counting observations.
reduce?HexbinReduce
How a bin's observations combine into its value: their number, or the sum or mean of valueDataKey.
- Default
"count", or "sum" when `valueDataKey` is set
colors?readonly string[]
The fills from the lowest values to the highest.
- Default
the sequential scale `var(--chart-scale-02)` … `var(--chart-scale-05)`
thresholds?readonly number[]
The values at which each fill after the first starts (one fewer than colors). Defaults to equal steps up to the largest bin.
gap?number
Gap between neighbouring hexagons, in pixels.
- Default
1.5
stroke?string
Border color of the hexagons.
fadeOnHover?boolean
Dim the layer's other marks while one is hovered or focused.
- Default
true
inactiveOpacity?number
Opacity of the other marks while one is hovered or focused.
- Default
0.35
HexbinGrid
horizontal?boolean
Show horizontal grid lines, at the y axis's ticks.
- Default
true
vertical?boolean
Show vertical grid lines, at the x axis's ticks.
- Default
false
stroke?string
Color of the grid lines.
- Default
"var(--chart-grid)"
strokeDasharray?string
Dash pattern of the grid lines.
- Default
"4 4"
HexbinXAxis
numTicks?number
Target number of tick labels.
- Default
5
formatValue?(value: number) => string
Formats a tick value into its label. Defaults to the number, thousands abbreviated (2k).
- Type
(value: number) => string
label?string
A title for the axis, drawn beside its labels.
HexbinYAxis
numTicks?number
Target number of tick labels.
- Default
5
formatValue?(value: number) => string
Formats a tick value into its label. Defaults to the number, thousands abbreviated (2k).
- Type
(value: number) => string
label?string
A title for the axis, drawn beside its labels.
HexbinTooltip
formatPosition?(x: number, y: number) => string
Formats the bin's x and y values for the default title.
- Type
(x: number, y: number) => string
#content?slot: { bin, index }
Custom tooltip content. Replaces the default title and rows, inside the same panel.
formatValue?(value: number) => string
Formats the value row of the default content.
- Type
(value: number) => string- Default
the number with thousands separators
valueLabel?string
The label of the value row of the default content.
class?string
Additional class name for the tooltip panel.
panelStyle?CSSProperties
Inline styles merged onto the tooltip panel.
backgroundColor?string
Background color of the tooltip panel. Overrides the theme's popover color.
HexbinLegend
title?string
A title before the legend's items.
formatValue?(value: number) => string
Formats the values the legend shows.
- Type
(value: number) => string- Default
the number, thousands abbreviated (`2k`)
align?"start" | "center" | "end"
Where the legend sits in the row under the plot.
- Type
"start" | "center" | "end"- Default
"center"
class?string
Additional class name for the legend.
Examples
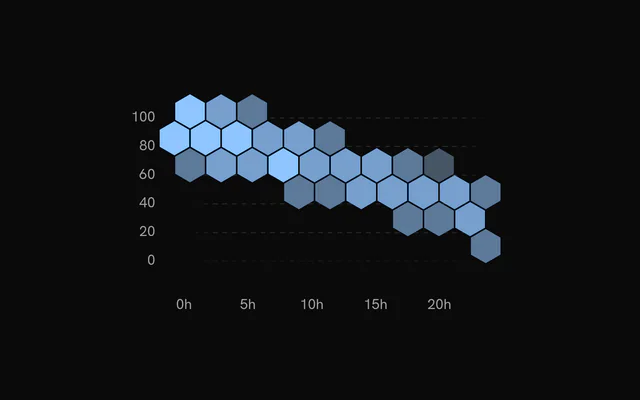
4 examples on Vue, each live with its code and its own install command.